
More Information
Submitted: June 17, 2025 | Approved: July 08, 2025 | Published: July 09, 2025
How to cite this article: Wang R. A Potential Causal Association of Pyroglutamine with Systemic Lupus Erythematosus Revealed by a Mendelian Randomization Analysis. J Clini Nephrol. 2025; 9(7): 076-082. Available from:
https://dx.doi.org/10.29328/journal.jcn.1001160
DOI: 10.29328/journal.jcn.1001160
Copyright license: © 2025 Wang R. This is an open access article distributed under the Creative Commons Attribution License, which permits unrestricted use, distribution, and reproduction in any medium, provided the original work is properly cited.
Keywords: Pyroglutamine; Genetic variants; SLE; Genome-wide association study; Mendelian randomization
Abbreviations: IVs: Instrumental Variants; SLE: Systemic Lupus Erythematosus; GWAS: Genome-wide Association Study; MR: Mendelian Randomization; SNP: Single Nucleotide Polymorphism; IVW: Inverse Variance Weighted

A Potential Causal Association of Pyroglutamine with Systemic Lupus Erythematosus Revealed by a Mendelian Randomization Analysis
Renxi Wang1,2*
1Beijing Institute of Brain Disorders, Laboratory of Brain Disorders, Ministry of Science and Technology, Collaborative Innovation Center for Brain Disorders, Capital Medical University, Beijing 100069, China
2Laboratory for Clinical Medicine, Capital Medical University, Beijing 100069, China
*Address for Correspondence: Renxi Wang, Beijing Institute of Brain Disorders, Laboratory of Brain Disorders, Ministry of Science and Technology, Collaborative Innovation Center for Brain Disorders, Capital Medical University, No.10 Xitoutiao, You An Men, Beijing 100069, China, Email: [email protected]
Pyroglutamate has been reported to be associated with many diseases such atherosclerosis, esophageal cancer, and COVID-19. However, it is still unclear about the role of blood pyroglutamate in Systemic Lupus Erythematosus (SLE). The present study used a two-sample Mendelian Randomization (MR) study to identify the potential causal association of pyroglutamine levels with SLE risk. Pyroglutamine-associated genetic Instrumental Variables (IVs) were chosen from the largest Genome-wide Association Studies (GWAS) for blood pyroglutamine-levels. The largest GWAS for SLE was employed to identify the potential causal association of blood pyroglutamine levels with SLE risk using a two-sample MR analysis. We successfully extracted three pyroglutamine-associated genetic IVs. Three IVs demonstrated no significant pleiotropy or heterogeneity in SLE GWAS. A two-sample MR analysis showed that as pyroglutamine genetically increased, the risk of SLE also increased using weighted median (OR = 3.994, 95% CI: [1.332 ∽ 11.970], p = 0.013) and Inverse Variance Weighted (IVW) (OR = 4.013, 95% CI: [1.484 ∽ 10.848], p = 0.006). Our analysis suggests a potential causal association of genetically increased pyroglutamine levels with increased SLE risk. Thus, pyroglutamine may be a potential risk factor for SLE.
Systemic Lupus Erythematosus (SLE) is a chronic autoimmune disease, characterized by heterogeneous rheumatic systemic disease, involved in cardiovascular, neuropsychiatric, dermatological, and renal symptoms [1-3]. Merging data have suggested that the prevalence of SLE is rising over time [4]. Globally, SLE incidence and newly diagnosed population were estimated to be 5.14 (95% CI [1.4 ∽ 15.13] per 100,000 person-years and 0.40 million people annually, respectively [5]. Currently, there is no cure for SLE and it remains a serious illness that can harm body systems [6]. Therefore, identifying risk factors is particularly important for preventing and alleviating symptoms of SLE.
SLE is triggered by a combination of genetic and environmental factors, such as medications, infections and stress [7-11]. Research suggests that hormonal factors are linked to SLE, though research is still in its infancy and the link between the two is still nebulous [7]. Viruses and bacteria may also cause lupus flares [8]. A subset of SLE, drug-induced lupus, is usually brought on by long-term use of certain medications such as anticonvulsants, antibiotics, and blood pressure medications [9]. Environmental factors, though not specifically proven, are believed to potentially trigger lupus and/or lupus flares [10]. Most researchers agree that genetics or heredity is at least one factor in determining your propensity for developing lupus [11]. However, the exact cause of lupus is still undetermined.
Genome-wide Association Studies (GWASs), Mendelian Randomization (MR) study, and observational studies of metabolites have suggested that pyroglutamine is a risk factor for hypertension [12] atherosclerosis [13,14], heart failure [15]. Mechanistically, pyroglutamine is significantly associated with vitamin D supplementation [13] and dietary protein intake [14]. Pyroglutamine is also related to risk of esophageal cancer [16], shows the strongest metabolite-risk signal for prostate cancer [17]. After multiple correction tests, pyroglutamine is still significantly correlated with type 2 Diabetes, obesity, retinopathy, and dyslipidemia [18,19]. We previously use a two-sample MR study to identify the genetic causal link between blood pyroglutamine levels and COVID-19 risk [20]. These studies suggest that pyroglutamine is a potential risk factor for many diseases.
Pyroglutamine is associated with high cholesterol levels and kidney function [19]. However, it is still unclear about the role of blood pyroglutamate in SLE. Highly similar to RCTs, MR studies have many advantages in assessing the causal link between an exposure and an outcome [21-27]. A key advantage of MR study is to use genetic variants independent of many factors that bias observational studies such as RCTs. Thus, the present study used a two-sample Mendelian Randomization (MR) study to identify the potential causal association of pyroglutamine levels with SLE risk.
Pyroglutamine and SLE GWASs
To explore how genetic variation influences metabolism and complex disease, Shin, et al. [28] used genome-wide association scans with high-throughput metabolic profiling to perform metabolism-associated GWAS. An atlas of genetic influences on human blood metabolites was published in 2014 [28]. In this study, pyroglutamine-associated GWAS has 7,800 European participants. The summary statistics for pyroglutamine-associated pyroglutamine are available at https://gwas.mrcieu.ac.uk/datasets/met-a-501. The profile of this GWAS is provided in Table 1.
| Table 1: Pyroglutamine and systemic lupus erythematosus-associated genome-wide association study. | ||||||||
| GWAS ID | Year | Trait | ncase | ncontrol | Sample size | Number of SNPs | Population | PMID |
| met-a-501 | 2014 | Pyroglutamine* | NA | NA | 7,800 | 2,545,655 | European | 24816252 |
| ebi-a-GCST003156 | 2015 | Systemic lupus erythematosus | 5,201 | 9,066 | 14,267 | 7,071,163 | European | 26502338 |
| GWAS ID: Genome-wide Association Study Identifier; ncase: The Number of Systemic Lupus Erythematosus Cases; ncontrol: The Number of the Controls; SNPs: Single-nucleotide Polymorphisms; PMID: Pubmed Unique Identifier; NA: Not Available | ||||||||
To determine the susceptibility loci for SLE, Bentham, et al. [29] performed SLE-associated GWAS comprised 7,219 cases and 15,991 controls of European ancestry. The largest GWAS for SLE was published in 2015 [29]. The summary dataset is available at https://gwas.mrcieu.ac.uk/datasets/ebi-a-GCST010780. The profile of this GWAS is provided in Table 1.
Extraction of pyroglutamine-associated genetic Instrumental Variables (IVs)
Pyroglutamine-associated genetic IVs were chosen from the largest GWAS for blood pyroglutamine level, based on the following three criteria: (1) p - value < 5 × 10⁻⁸ as genome-wide significance threshold; (2) r2 < 0.001, indicating no linkage disequilibrium between SNPs by the Linkage Disequilibrium (LD) analysis using LDlink (https://ldlink.nci.nih.gov/?tab=ldmatrix, CEU); (3) no effects on other potential risk factors including body mass index, smoking, and blood pressure. F- statistic was used to assess the strength of relationship between pyroglutamine-associated genetic IVs and blood pyroglutamine level, and calculated using the following equation: F = R2 * (N-2)/(1− R2) [30], where R2 is the proportion of pyroglutamine variance, k is the number of instruments used in the model and n is the sample size.
Evaluation of pyroglutamine-associated IV pleiotropy and heterogeneity in SLE GWAS
In testing the pleiotropy of pyroglutamine-associated IVs in SLE GWAS, MR-egger_intercept and MR-pleiotropy residual sum and outlier (MR-PRESSO) tests have broadly been used [31]. Based on the same regression model with Inverse Variance Weighted (IVW), MR-Egger intercept test allows and accounts for the potential pleiotropy [31-33]. If the selected IVs are not pleiotropic, then the MR_Egger intercept should tend to zero as the sample size increases [33]. MR-PRESSO could detect and correct for the horizontal pleiotropy via outlier removal (the MR-PRESSO outlier test) [31].
In testing the heterogeneity of pyroglutamine-associated IVs in SLE GWAS, MR_egger and IVW in Cochran’s Q statistic have been broadly used [34,35]. Cochran’s Q statistic could provide evidence of heterogeneity due to pleiotropy or other causes [34].
MR analysis
Both IVW and weighted median methods were used to analyze the causal association of blood pyroglutamine levels with SLE risk. The IVW was selected as the main MR analysis method to combine the variant-specific Wald estimators by taking the inverse of their approximate variances as the corresponding weights [33]. In addition, we also selected the weighted median that could produce consistent estimates even up to 50% of selected genetic variants are not valid [31-33]. Finally, individual causal effect, single SNP effect size, and leave-one-out effect were used to explore each effect of pyroglutamine-associated IVs on SLE, respectively. A p - value < 0.05 represents significant difference.
Three pyroglutamine-associated IVs have no significant pleiotropy or heterogeneity in SLE GWAS dataset
Three independent pyroglutamine-associated genetic variants as potential IVs were successfully chose from blood pyroglutamine level-associated GWAS (Tables 1,2). All these selected four genetic variants could explain 2.82% variance of blood pyroglutamine levels (Table 2). The F- statistics of the selected three IVs were all above the threshold of weak instruments (< 10) of F- statistic [36], indicating strong IVs for this MR analysis (Table 2). We successfully extracted three independent pyroglutamine-associated genetic IVs (Table 2) from SLE GWAS dataset (Table 1). The association of pyroglutamine-associated IVs within SLE GWAS dataset is shown (Table 3). No significant pleiotropy or heterogeneity of three independent pyroglutamine-associated IVs were determined in SLE GWAS dataset (Table 4). Therefore, all selected pyroglutamine-associated IVs can be taken as the effective IVs in our MR analysis.
| Table 2: Pyroglutamine-associated genetic instrumental variables. | |||||||||
| SNP | EA | NEA | EAF | Beta | SE | p - value | Sample size | R |
F- statistics |
| rs11613331 | A | G | 0.553 | 0.037 | 0.004 | 2.23E-25 | 7354 | 1.45 | 35.97 |
| rs1600760 | A | T | 0.663 | -0.022 | 0.004 | 5.12E-09 | 7354 | 0.46 | 11.36 |
| rs715 | C | T | 0.286 | -0.036 | 0.004 | 2.46E-16 | 7354 | 0.91 | 22.43 |
| SNP: Single-nucleotide polymorphism; EA: Effect Allele; NEA: Non-effect Allele; EAF: Effect Allele Frequency; Beta: The Regression Coefficient based on the pyroglutamine Effect Allele; SE: Standard Error; R |
|||||||||
| Table 3: Association of pyroglutamine genetic instrumental variables with systemic lupus erythematosus-associated genome-wide association study. | ||||||
| SNP | Exposure (Pyroglutamine) | Outcome (SLE) | ||||
| Beta | SE | p - value | Beta | SE | p value | |
| rs11613331 | 0.037 | 0.0036 | 2.23E-25 | 0.051 | 0.027 | 0.058 |
| rs1600760 | -0.022 | 0.0037 | 5.12E-09 | -0.030 | 0.030 | 0.319 |
| rs715 | -0.036 | 0.0044 | 2.46E-16 | -0.051 | 0.030 | 0.088 |
| SLE: Systemic Lupus Erythematosus; SNP: Single-nucleotide Polymorphism; Beta: The Regression Coefficient based on Pyroglutamine Raising Effect Allele; SE: Standard Error. | ||||||
| Table 4: Pleiotropy and heterogeneity test of pyroglutamine genetic instrumental variables in systemic lupus erythematosus-associated genome-wide association study. | ||||||||||
| Pleiotropy test | Heterogeneity test | |||||||||
| MR_Egger | MR_Egger | IVW | ||||||||
| Intercept | SE | p value | Q | Q_df | Q_ p - value | Q | Q_df | Q_ p - value | ||
| -0.001 | 0.077 | 0.991 | 0.002 | 1 | 0.963 | 0.002 | 2 | 0.999 | ||
| IVW: Inverse Variance Weighted; SE: Standard Error. p value > 0.05 represent no significant pleiotropy. Q_p value > 0.05 represents no significant heterogeneity. | ||||||||||
Pyroglutamine genetically promotes SLE risk
IVW method demonstrated that as pyroglutamine genetically increased, the risk of SLE increased (Beta = 1.389 [95% CI: 0.395 ∽ 2.384], OR = 4.013 [95% CI: 1.484 ∽ 10.848], p = 0.006). Weighted median method also demonstrated that pyroglutamine genetically increased the risk of SLE (Beta = 1.385 [95% CI: 0.287 ∽ 2.482], OR = 3.994 [95% CI: 1.332 ∽ 11.970], p = 0.013) (Table 5). Collectively, our data suggested a causal link between genetically increased pyroglutamine levels and the increased risk of SLE.
| Table 5: The causal association of blood pyroglutamine levels with systemic lupus erythematosus. | |||||||||
| Method | nsnp | Beta | SE | p - value | Beta_lci95 | Beta_uci95 | OR | OR_lci95 | OR_uci95 |
| IVW | 3 | 1.389 | 0.507 | 0.006 | 0.395 | 2.384 | 4.013 | 1.484 | 10.848 |
| Weighted median | 3 | 1.385 | 0.560 | 0.013 | 0.287 | 2.482 | 3.994 | 1.332 | 11.970 |
| IVW: Inverse Variance Weighted; nsnp: The Number of Single-nucleotide Polymorphism; Beta: The Regression Coefficient based on Pyroglutamine Raising Effect Allele; SE: Standard Error; p value < 0.05 represents the causal association of the increased pyroglutamine levels with systemic lupus erythematosus; Beta_lci95: Lower Limit of 95% Confidence Interval for Beta; Beta_uci95: Upper Limit of 95% Confidence Interval for Beta; OR: Odds Ratio; OR_lci95: Lower Limit of 95% Confidence Interval for OR; OR_uci95: Upper Limit of 95% Confidence Interval for OR. |
|||||||||
Single SNP effect of pyroglutamine on SLE is robust without obvious bias
The individual MR estimates demonstrated that as the effect of single SNP on pyroglutamine increased, the promoting effect of single SNP on SLE increased using IVW and weighted median (Figure 1). All effect size analyses suggest that each effect of pyroglutamine SNPs on SLE was robust (Figure 2). MR leave-one-out sensitivity analysis suggested that removing a specific SNP of the three pyroglutamine SNPs did not change the results (Figure 3). Altogether, these results indicate that our data were robust without obvious bias.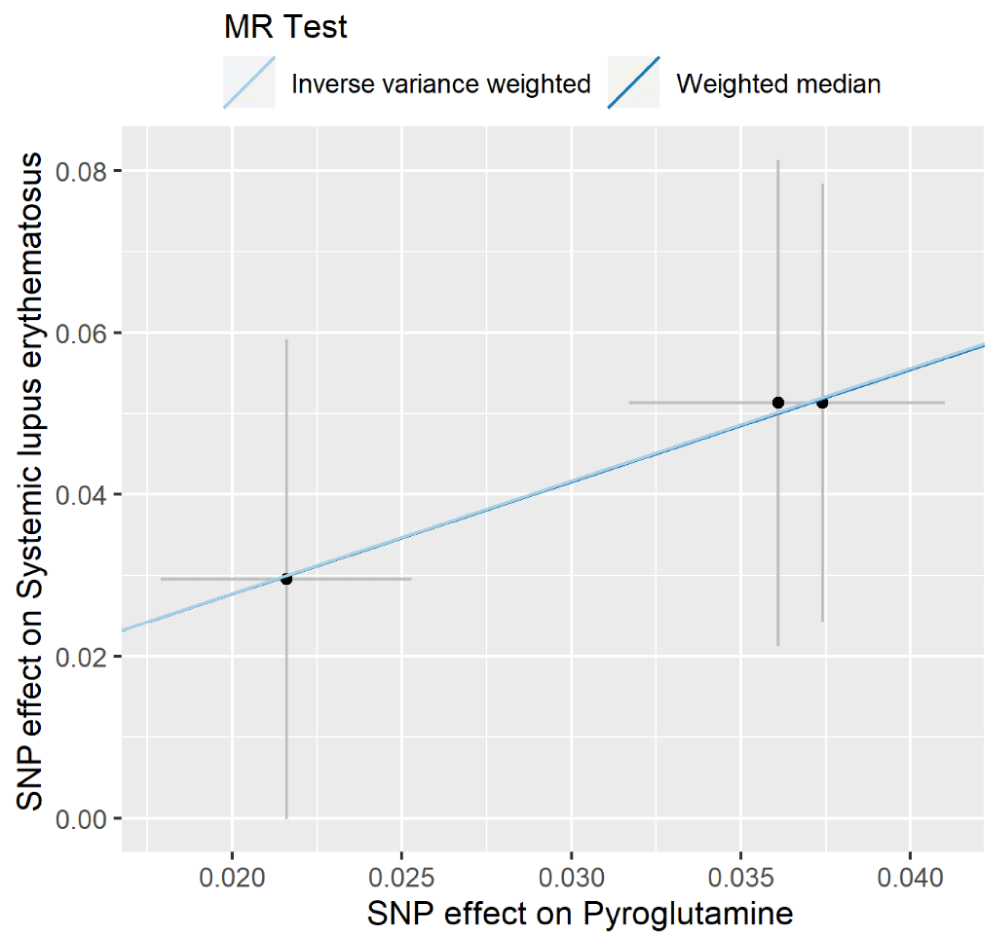
Figure 1: Individual estimates about the causal effect of pyroglutamine on SLE. The x-axis shows the single SNP (single nucleotide polymorphism) effect (beta value: the regression coefficient based on pyroglutamine raising effect allele, dark dots) and standard error (SE, horizontal cross lines) of three pyroglutamine-associated SNPs on dairy smoothie intake. The y-axis shows the single SNP effect (beta value, dark dots) and SE (vertical cross lines) of three pyroglutamine-associated SNPs on SLE risk. The regression lines are shown using Inverse Variance Weighted (IVW) and weighted median methods.
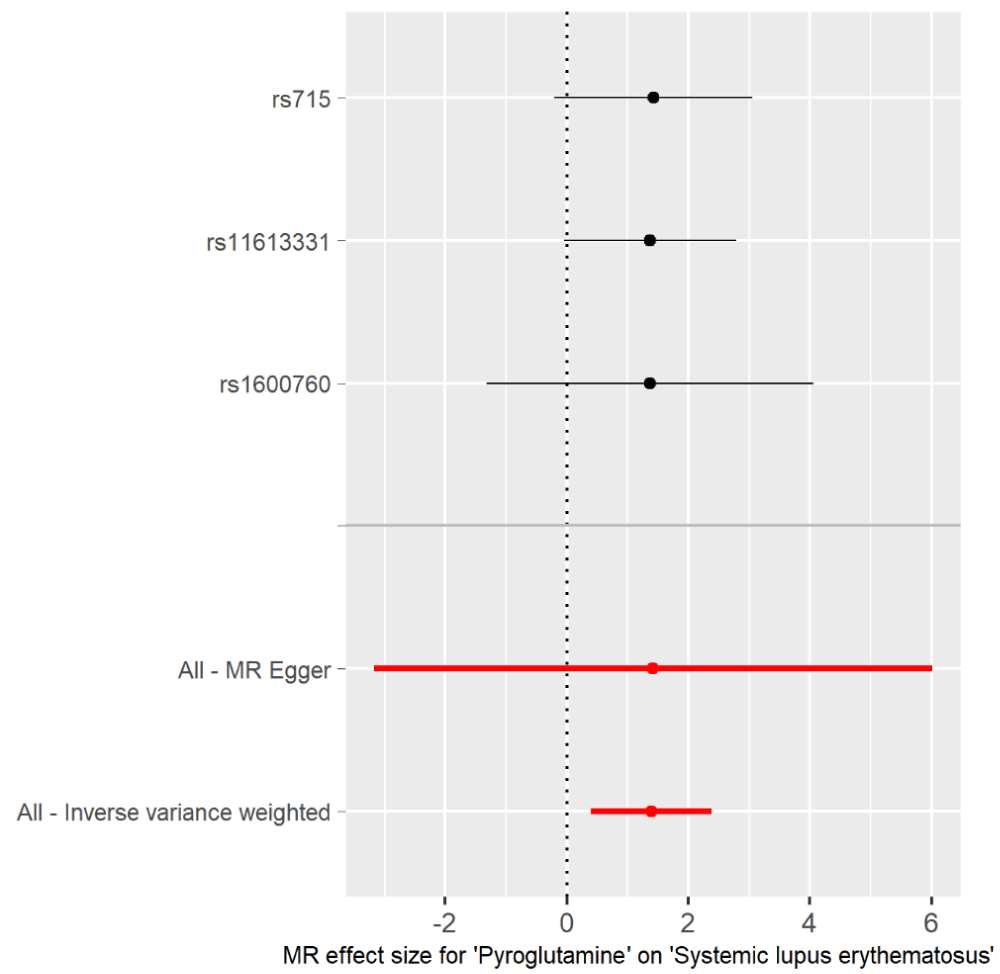
Figure 2: Forest plot of pyroglutamine associated with risk of SLE. The x-axis shows the MR effect size for pyroglutamine on SLE. The y-axis shows the analysis for the single SNP and the total SNPs. Dark and red dots represent the single and the total SNP effect (Beta value), respectively. SE: horizontal cross lines. Red dots and lines represent overall causal effects estimated using MR Egger and IVW. The beta value of 0: vertical dotted line.
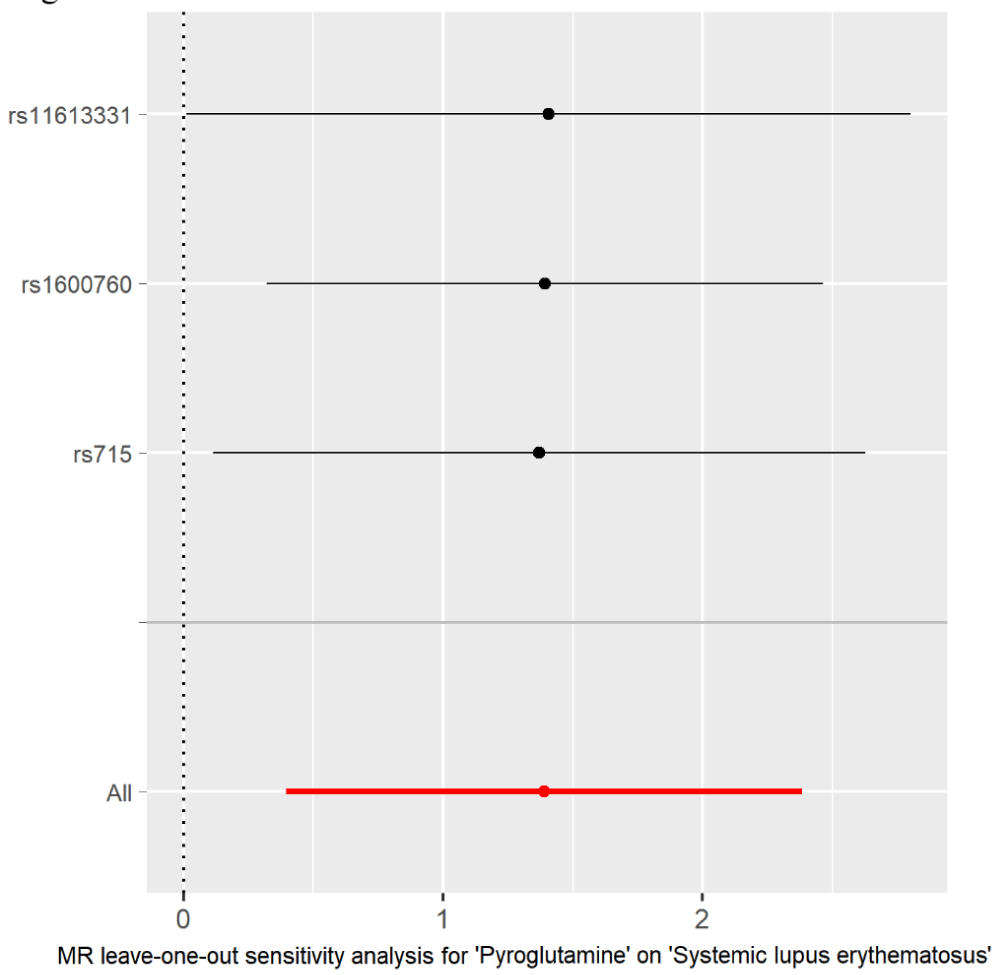
Figure 3: MR leave-one-out sensitivity analysis for the effect of pyroglutamine SNPs on SLE. The x-axis shows MR leave-one-out sensitivity analysis of three pyroglutamine-associated SNP effect on SLE risk. The y-axis shows leave-one-out effect of SNPs and the total SNPs on SLE using IVW. Dark and red dots represent the single and the total SNP effect (beta value), respectively. SE: horizontal cross lines. The beta value of 0: vertical dotted line.
Previous studies suggest that pyroglutamine is a potential risk factor for hypertension [12], atherosclerosis [13,14], heart failure [15], esophageal cancer [16], prostate cancer [17], type 2 diabetes, obesity, retinopathy, dyslipidemia [18,19] and COVID-19 [20]. The present two-sample MR analysis suggests a causal association of genetically increased pyroglutamine levels with increased risk of SLE. Our results showed that a genetic predisposition to a higher pyroglutamine level may be associated with increased risk of SLE.
Previous studies have used MR study and found that genetically predicted 486 blood metabolites including pyroglutamine in relation to risk of esophageal cancer [16]. In this MR analysis, p < 1 × 10⁻⁵ was used as the threshold to select genetic variants as IVs. The other MR study explored relationship between circulating metabolites including pyroglutamine and diabetic retinopathy [18]. In this MR analysis, p < 1 × 10⁻⁶ was used as the threshold to select genetic variants as IVs. Over the last decade, GWAS meta-analyses have used a strict p - value threshold of 5 × 10⁻⁸ to classify associations as significant [37]. This is to reduce a false discovery rate [38]. Therefore, we used p < 1 × 10⁻⁸ as the threshold to select genetic variants as IVs in our MR analysis.
Of three selected pyroglutamine-associated IVs, rs715 has been reported to be associated with colorectal cancer recurrence [39], macular telangiectasia type 2 [40], coronary artery disease [41] and type 2 diabetes [42]. A nationwide cohort study in Taiwan showed increased risk of type 2 diabetes in patients with systemic lupus erythematosus [43]. Paraneoplastic SLE is also associated with colorectal cancer [44]. Thus, rs715 may be a common risk factor for these diseases. It is worth further research the explore the role of rs715 or the two IVs in SLE.
Pyroglutamine is a cyclic derivative of glutamine related to pyroglutamate [45]. Notably, pyroglutamate promotes the survival of retinal ganglion cells [46], consistent with the observed decrease in glutamate in retinopathy [19]. It also reveals the possible roles of pyroglutamine in association with high cholesterol and kidney function [19]. A higher concentration of pyroglutamate in interstitial fluid in the hypertensive might indicate alterations in biochemical pathways associated with glucose metabolism [47,48]. Pyroglutamate is also an intermediate in the glutathione metabolism [49], involved in increased levels of oxidative stress/inflammation [12]. Increased oxidative stress is involved in causing inflammatory and cellular defects in the pathogenesis of SLE [50]. However, it is unclear about the detailed mechanisms underlying pyroglutamine-mediated the pathogenesis of SLE.
This study has several strengths. First, three pyroglutamine genetic IVs are chosen from the largest pyroglutamine-associated GWAS, reported by Shin, et al. in 2014 [28]. Second, we used the largest GWAS for SLE described by Bentham, et al. [29] in 2015. Third, both pyroglutamine and SLE GWASs are from European ancestry. Thus, it reduced the influence of population stratification. Fourth, all four different analysis methods demonstrated no significant pleiotropy or heterogeneity of pyroglutamine-associated genetic IVs in SLE GWAS dataset. Fifth, both IVW and weighted median proved a causal link between genetically increased pyroglutamine levels and increased risk of SLE. Finally, all three methods demonstrated that each effect of pyroglutamine-associated IVs on SLE risk was robust without obvious bias.
This study has several limitations. First, once a larger GWAS is available, the instrument panel can further expand to raise the sample size and allow MR-Egger with adequate power. Second, limited experimental or mechanistic evidences were used to show how pyroglutamine might modulate immune tolerance. Although of no reverse causal effect of SLE on pyroglutamine, reverse causation through yet-unknown feedback loops remains possible without functional validation. Third, due to no available GWAS on diverse populations, we did not conduct replication studies to ensure the generalizability of the findings. In addition, findings may not generalize to other ancestries where allele frequencies and linkage patterns differ. Thus, the generalizability of the findings needs be tested once GWASs on diverse populations are available. Fourth it is necessary to clarify whether pyroglutamine could increase the risk of SLE by randomized controlled trials. Finally, it is still unclear about the underlying mechanism by which pyroglutamine genetically increased SLE risk that is worth to be explored in the future. Further research on pyroglutamine is needed since too little is known so far about its physiological role in SLE. Integration of transcriptomic and proteomic MR to map the metabolic pathway, and then test in cell or animal models whether modulating pyroglutamine alters lupus-like phenotypes may be guaranteed to explore the role of pyroglutamine in SLE.
In conclusion, our analysis suggested a causal link between genetically increased pyroglutamine and increased risk of SLE. Thus, pyroglutamine may be a risk factor for patients with SLE.
Declarations
Availability of data and materials: The datasets generated during and/or analyzed during the current study are available from the corresponding author [Renxi Wang], on reasonable request.
Funding: This study was supported by grants from National Natural Science Foundation of China (2270933), R&D Program of Beijing Municipal Education Commission (KZ202210025035), and Chinese Institutes for Medical Research, Beijing (Grant No. CX24PY07).
Authors’ contributions: RW conceived and initiated the project, analyzed the data, and wrote the manuscript. All authors contributed to the interpretation of the results and critical revision of the manuscript. All authors have read and approved the final version of the manuscript.
- Rua-Figueroa Fernandez de Larrinoa I. What is new in systemic lupus erythematosus. Reumatol Clin. 2015;11(1):27-32. Available from: https://doi.org/10.1016/j.reuma.2014.09.004
- Fortu G, Brennan MT. Systemic lupus erythematosus: epidemiology, pathophysiology, manifestations, and management. Dent Clin North Am. 2013;57(4):631-55. Available from: https://doi.org/10.1016/j.cden.2013.06.003
- Yu H, Nagafuchi Y, Fujio K. Clinical and Immunological Biomarkers for Systemic Lupus Erythematosus. Biomolecules. 2021;11(7):928. Available from: https://doi.org/10.3390/biom11070928
- Barber MRW, Drenkard C, Falasinnu T, Hoi A, Mak A, Kow NY, et al. Global epidemiology of systemic lupus erythematosus. Nat Rev Rheumatol. 2021;17(9):515-32. Available from: https://doi.org/10.1038/s41584-021-00668-1
- Tian J, Zhang D, Yao X, Huang Y, Lu Q. Global epidemiology of systemic lupus erythematosus: a comprehensive systematic analysis and modelling study. Ann Rheum Dis. 2023;82(3):351-6. Available from: https://doi.org/10.1136/ard-2022-223035
- Arnaud L, Tektonidou MG. Long-term outcomes in systemic lupus erythematosus: trends over time and major contributors. Rheumatology (Oxford). 2020;59(Suppl5):v29-v38. Available from: https://doi.org/10.1093/rheumatology/keaa382
- McDonald G, Cabal N, Vannier A, Umiker B, Yin RH, Orjalo AV, Jr., et al. Female Bias in Systemic Lupus Erythematosus is Associated with the Differential Expression of X-Linked Toll-Like Receptor 8. Front Immunol. 2015;6:457. Available from: https://doi.org/10.3389/fimmu.2015.00457
- Francis L, Perl A. Infection in systemic lupus erythematosus: friend or foe? Int J Clin Rheumtol. 2010;5(1):59-74. Available from: https://doi.org/10.2217/ijr.09.72
- Solhjoo M, Goyal A, Chauhan K. Drug-Induced Lupus Erythematosus. In: StatPearls. Treasure Island (FL): StatPearls Publishing; 2025. Available from: https://www.ncbi.nlm.nih.gov/books/NBK441889/
- Mak A, Tay SH. Environmental factors, toxicants and systemic lupus erythematosus. Int J Mol Sci. 2014;15(9):16043-56. Available from: https://doi.org/10.3390/ijms150916043
- Vaughn SE, Kottyan LC, Munroe ME, Harley JB. Genetic susceptibility to lupus: the biological basis of genetic risk found in B cell signaling pathways. J Leukoc Biol. 2012;92(3):577-91. Available from: https://doi.org/10.1189/jlb.0212095
- Chachaj A, Matkowski R, Grobner G, Szuba A, Dudka I. Metabolomics of Interstitial Fluid, Plasma and Urine in Patients with Arterial Hypertension: New Insights into the Underlying Mechanisms. Diagnostics (Basel). 2020;10(11):936. Available from: https://doi.org/10.3390/diagnostics10110936
- Sullivan VK, Chen J, Bernard L, Yu B, Michos ED, Appel LJ, et al. Serum and urine metabolite correlates of vitamin D supplementation in the Atherosclerosis Risk in Communities (ARIC) study. Clin Nutr ESPEN. 2025;67:523-32. Available from: https://doi.org/10.1016/j.clnesp.2025.03.172
- Bernard L, Chen J, Kim H, Wong KE, Steffen LM, Yu B, et al. Metabolomics of Dietary Intake of Total, Animal, and Plant Protein: Results from the Atherosclerosis Risk in Communities (ARIC) Study. Curr Dev Nutr. 2023;7(4):100067. Available from: https://doi.org/10.1016/j.cdnut.2023.100067
- Yu B, Zheng Y, Alexander D, Manolio TA, Alonso A, Nettleton JA, et al. Genome-wide association study of a heart failure related metabolomic profile among African Americans in the Atherosclerosis Risk in Communities (ARIC) study. Genet Epidemiol. 2013;37(8):840-5. Available from: https://doi.org/10.1002/gepi.21752
- Jia C, Yi D, Ma M, Xu Q, Ou Y, Kong F, et al. Genetically predicted 486 blood metabolites in relation to risk of esophageal cancer: a Mendelian randomization study. Front Mol Biosci. 2024;11:1391419. Available from: https://doi.org/10.3389/fmolb.2024.1391419
- Huang J, Mondul AM, Weinstein SJ, Koutros S, Derkach A, Karoly E, et al. Serum metabolomic profiling of prostate cancer risk in the prostate, lung, colorectal, and ovarian cancer screening trial. Br J Cancer. 2016;115(9):1087-95. Available from: https://doi.org/10.1038/bjc.2016.305
- Ma L, Dong Y, Li Z, Meng J, Zhao B, Wang Q. Relationship between circulating metabolites and diabetic retinopathy: a two-sample Mendelian randomization analysis. Sci Rep. 2024;14(1):4964. Available from: https://doi.org/10.1038/s41598-024-55704-3
- Yousri NA, Suhre K, Yassin E, Al-Shakaki A, Robay A, Elshafei M, et al. Metabolic and Metabo-Clinical Signatures of Type 2 Diabetes, Obesity, Retinopathy, and Dyslipidemia. Diabetes. 2022;71(2):184-205. Available from: https://doi.org/10.2337/db21-0490
- Su W, Zhou S, Zhu G, Xu Y, Gao R, Zhang M, et al. Mendelian Randomization Study on Causal Association of Pyroglutamine with COVID-19. J Epidemiol Glob Health. 2022;12(4):541-7. Available from: https://doi.org/10.1007/s44197-022-00073-1
- Gao R, Xu Y, Zhu G, Zhou S, Li H, Han G, et al. Genetic variation associated with COVID-19 is also associated with endometrial cancer. J Infect. 2022;84(5):e85-e6. Available from: https://doi.org/10.1016/j.jinf.2022.01.026
- Wang R. Mendelian randomization study updates the effect of 25-hydroxyvitamin D levels on the risk of multiple sclerosis. J Transl Med. 2022;20(1):3. Available from: https://doi.org/10.1186/s12967-021-03205-6
- Wang R. Genetic variation of interleukin-1 receptor type 1 is associated with severity of COVID-19 disease. J Infect. 2022;84(2):e19-e21. Available from: https://doi.org/10.1016/j.jinf.2021.12.010
- Xu Y, Gao R, Zhu G, Zhou S, Li H, Su W, et al. Genetic variation of allergic disease is associated with the susceptibility to COVID-19. J Infect. 2022;84(5):e92-e3. Available from: https://doi.org/10.1016/j.jinf.2022.01.015
- Zhou S, Zhu G, Xu Y, Gao R, Li H, Han G, et al. Mendelian Randomization Study on the Putative Causal Effects of Omega-3 Fatty Acids on Low Back Pain. Front Nutr. 2022;9:819635. Available from: https://doi.org/10.3389/fnut.2022.819635
- Zhu G, Zhou S, Xu Y, Gao R, Li H, Su W, et al. Mendelian randomization study on the causal effects of COVID-19 on childhood intelligence. J Med Virol. 2022;94(7):3233-9. Available from: https://doi.org/10.1002/jmv.27736
- Zhu G, Zhou S, Xu Y, Gao R, Li H, Zhai B, et al. Mendelian randomization study on the causal effects of omega-3 fatty acids on rheumatoid arthritis. Clin Rheumatol. 2022;41(5):1305-12. Available from: https://doi.org/10.1007/s10067-022-06052-y
- Shin SY, Fauman EB, Petersen AK, Krumsiek J, Santos R, Huang J, et al. An atlas of genetic influences on human blood metabolites. Nat Genet. 2014;46(6):543-50. Available from: https://doi.org/10.1038/ng.2982
- Bentham J, Morris DL, Graham DSC, Pinder CL, Tombleson P, Behrens TW, et al. Genetic association analyses implicate aberrant regulation of innate and adaptive immunity genes in the pathogenesis of systemic lupus erythematosus. Nat Genet. 2015;47(12):1457-64. Available from: https://doi.org/10.1038/ng.3434
- Zhang W, Wu P, Yin R, Sun M, Zhang R, Liao X, et al. Mendelian Randomization Analysis Suggests No Associations of Herpes Simplex Virus Infections With Multiple Sclerosis. Front Neurosci. 2022;16:817067. Available from: https://doi.org/10.3389/fnins.2022.817067
- Verbanck M, Chen CY, Neale B, Do R. Detection of widespread horizontal pleiotropy in causal relationships inferred from Mendelian randomization between complex traits and diseases. Nat Genet. 2018;50(5):693-8. Available from: https://doi.org/10.1038/s41588-018-0099-7
- Bowden J, Davey Smith G, Haycock PC, Burgess S. Consistent Estimation in Mendelian Randomization with Some Invalid Instruments Using a Weighted Median Estimator. Genet Epidemiol. 2016;40(4):304-14. Available from: https://doi.org/10.1002/gepi.21965
- Burgess S, Thompson SG. Interpreting findings from Mendelian randomization using the MR-Egger method. Eur J Epidemiol. 2017;32(5):377-89. Available from: https://doi.org/10.1007/s10654-017-0255-x
- Greco MF, Minelli C, Sheehan NA, Thompson JR. Detecting pleiotropy in Mendelian randomisation studies with summary data and a continuous outcome. Stat Med. 2015;34(21):2926-40. Available from: https://doi.org/10.1002/sim.6522
- Liu G, Zhang S, Cai Z, Ma G, Zhang L, Jiang Y, et al. PICALM gene rs3851179 polymorphism contributes to Alzheimer's disease in an Asian population. Neuromolecular Med. 2013;15(2):384-8. Available from: https://doi.org/10.1007/s12017-013-8225-2
- Burgess S, Thompson SG, Collaboration CCG. Avoiding bias from weak instruments in Mendelian randomization studies. Int J Epidemiol. 2011;40(3):755-64. Available from: https://doi.org/10.1093/ije/dyr036
- Chen Z, Boehnke M, Wen X, Mukherjee B. Revisiting the genome-wide significance threshold for common variant GWAS. G3 (Bethesda). 2021;11(2):jkaa056. Available from: https://doi.org/10.1093/g3journal/jkaa056
- Gampawar P, Hofer E, Alonso N. Analysis of Genome-Wide Association Studies. Methods Mol Biol. 2025;2885:695-715. Available from: https://doi.org/10.1007/978-1-0716-4306-8_35
- Fleming CA, Mohan HM, O'Leary DP, Corrigan M, Redmond HP. Metabolomic Pathway Activity with Genomic Single-Nucleotide Polymorphisms Associated with Colorectal Cancer Recurrence and 5-Year Overall Survival. J Gastrointest Cancer. 2023;54(1):247-58. Available from: https://doi.org/10.1007/s12029-022-00813-3
- Scerri TS, Quaglieri A, Cai C, Zernant J, Matsunami N, Baird L, et al. Genome-wide analyses identify common variants associated with macular telangiectasia type 2. Nat Genet. 2017;49(4):559-67. Available from: https://doi.org/10.1038/ng.3799
- Hartiala JA, Tang WH, Wang Z, Crow AL, Stewart AF, Roberts R, et al. Genome-wide association study and targeted metabolomics identifies sex-specific association of CPS1 with coronary artery disease. Nat Commun. 2016;7:10558. Available from: https://doi.org/10.1038/ncomms10558
- Xie W, Wood AR, Lyssenko V, Weedon MN, Knowles JW, Alkayyali S, et al. Genetic variants associated with glycine metabolism and their role in insulin sensitivity and type 2 diabetes. Diabetes. 2013;62(6):2141-50. Available from: https://doi.org/10.2337/db12-0876
- Lin YJ, Chien CC, Ho CH, Chen HA, Chen CY. Increased risk of type 2 diabetes in patients with systemic lupus erythematosus: A nationwide cohort study in Taiwan. Medicine (Baltimore). 2022;101(51):e32520. Available from: https://doi.org/10.1097/md.0000000000032520
- Rees MJ, Steinberg A, Romas E, Ford S, Roberts V, Ierino FL. Paraneoplastic systemic lupus erythematosus associated with colorectal cancer. Oxf Med Case Reports. 2019;2019(2):omy131. Available from: https://doi.org/10.1093/omcr/omy131
- Liu YD, Goetze AM, Bass RB, Flynn GC. N-terminal glutamate to pyroglutamate conversion in vivo for human IgG2 antibodies. J Biol Chem. 2011;286(13):11211-7. Available from: https://doi.org/10.1074/jbc.m110.185041
- Oono S, Kurimoto T, Nakazawa T, Miyoshi T, Okamoto N, Kashimoto R, et al. Pyroglutamic acid promotes survival of retinal ganglion cells after optic nerve injury. Curr Eye Res. 2009;34(7):598-605. Available from: https://doi.org/10.1080/02713680902981292
- Xu F, Tavintharan S, Sum CF, Woon K, Lim SC, Ong CN. Metabolic signature shift in type 2 diabetes mellitus revealed by mass spectrometry-based metabolomics. J Clin Endocrinol Metab. 2013;98(6):E1060-5. Available from: https://doi.org/10.1210/jc.2012-4132
- Chou J, Liu R, Yu J, Liu X, Zhao X, Li Y, et al. Fasting serum alpha-hydroxybutyrate and pyroglutamic acid as important metabolites for detecting isolated post-challenge diabetes based on organic acid profiles. J Chromatogr B Analyt Technol Biomed Life Sci. 2018;1100-1101:6-16. Available from: https://doi.org/10.1016/j.jchromb.2018.09.004
- Roesel RA, Hommes FA, Samper L. Pyroglutamic aciduria (5-oxoprolinuria) without glutathione synthetase deficiency and with decreased pyroglutamate hydrolase activity. J Inherit Metab Dis. 1981;4(2):89-90. Available from: https://doi.org/10.1007/bf02263605
- Yan Z, Chen Q, Xia Y. Oxidative Stress Contributes to Inflammatory and Cellular Damage in Systemic Lupus Erythematosus: Cellular Markers and Molecular Mechanism. J Inflamm Res. 2023;16:453-65. Available from: https://doi.org/10.2147/jir.s399284