
More Information
Submitted: April 09, 2021 | Approved: July 19, 2021 | Published: July 20, 2021
How to cite this article: Keita N, Faye M, Seck SM, Ndong B, Faye M, et al. Usefulness of foot-to-foot bioimpedance analysis for assessing volume status in chronic hemodialysis patients at the Aristide Le Dantec University Hospital (Senegal). J Clini Nephrol. 2021; 5: 056-060.
DOI: 10.29328/journal.jcn.1001075
Copyright License: © 2021 Keita N, et al. This is an open access article distributed under the Creative Commons Attribution License, which permits unrestricted use, distribution, and reproduction in any medium, provided the original work is properly cited.
Keywords: Hemodialysis; Bioimpedance; Total body water; Watson
Abbreviations: BIA: Bioelectrical Impedance Analysis; SF-BIA: Single-Frequency BIA; MF-BIA: Multi-Frequency BIA; BP: Blood Pressure; SBP: Systolic Blood Pressure; DBP: Diastolic Blood Pressure; CHD: Chronic Hemodialysis; TBW: Total Body Water

Usefulness of foot-to-foot bioimpedance analysis for assessing volume status in chronic hemodialysis patients at the Aristide Le Dantec University Hospital (Senegal)
Niakhaleen Keita1*, Maria Faye1, Sidy Mouhamed Seck2, Boucar Ndong3, Moustapha Faye1, Ahmed Tall Lemrabott1, Bacary Ba1, Seynabou Diagne1, Mansour Mbengue1, Ameth Dieng1, Mamadou Aw Ba1, Abdou Sy1, Modou Ndongo1, Babacar Ndiaye1 and Elhadji Fary Ka1
1Aristide Le Dantec University Hospital, Nephrology, Dialysis and Kidney Transplant Department, Cheikh Anta Diop University, Dakar, Senegal
2Ouakam Military Hospital, Nephrology and Dialysis Department, Gaston Berger University, Saint-Louis, Senegal
3Biophysics and Nuclear Medicine Department, Medicine Pharmacy and Odontology Faculty, Cheikh Anta Diop University (UCAD), Dakar, Senegal
*Address for Correspondence: Niakhaleen Keita, MD, Nephrologist, 30, Avenue Pasteur 3001 Dakar, Senegal, Tel: 00 221 77 738 00 56; Email: [email protected]
Introduction: Determination of dry weight is one of the daily goals to achieve in hemodialysis. The aim of this study was to validate the use of bioelectrical impedance analysis (BIA) in estimation of dry weight in a population of Senegalese chronic hemodialysis patients.
Patients and methods: A 9-week cross-sectional study was carried out at the hemodialysis unit of Aristide Le Dantec University Hospital. Adult patients with no previous hospital history were included. The total body water (TBW) was measured with a single frequency bioelectric impedance foot-to-foot analyzer, before and after six successive hemodialysis sessions. These results were compared with those from clinical measurements with the Watson equation using a Student’s t-test and Bland-Altman analysis.
Results: 264 measurements were made in 22 patients (46.6 years, 54.5% men, 92.3 months on dialysis, 62.7 kg mean dry weight). A significant reduction in weight (ΔWeight = 2.0 ± 1.1 kg; p < 0.0001) and in TBW measured by the BIA (ΔTBWBIA = 3.3 ± 1.0 liters; p < 0.0001)) or calculated by Watson’s equation (ΔTBWWatson = 0.5 ± 0.2 liter; p = 0.0001) was observed. There was a strong linear correlation and agreement between the 2 TBW measurements in pre-dialysis. In post-dialysis the concordance diagram indicated a bias = –2.2 and wide agreement limits.
Conclusion: The BIA allows reproducible and reliable measurements and a fair estimate of the TBW in pre-dialysis.
Determining dry body weight is essential in chronic hemodialysis (CHD) patients. Indeed, its overestimation can be the cause of chronic hyperhydration, which is an independent factor of mortality in CHD patients [1]. On the other hand, the underestimation of dry weight will lead to dehydration and consequently, cramps and hypotension during the hemodialysis session [2]. That is why a strict control of fluid volume and a properly estimated dry weight are necessary to normalize blood pressure (BP) and increase survival in CHD patients [3]. In our times, there are several methods for estimating dry weight, including bioimpedance. The latter allows an estimation of total body water (TBW) using a mathematical modeling [4]. Its advantages include the assessment of lean mass and fat mass, as well as water status [5]. In that manner, it allows an analysis of the body composition at the bedside of the patient. In the recent years, bioelectric impedance spectroscopy and impedance analyzers have been extensively tested to aid in clinical decision-making for dry weight estimation in CHD patients. This method has been shown to be useful in adapting the dialysis prescription to the individual needs of patients [6,7]. Its reproducibility allows a long-term monitoring in the changes of the hydration state of CHD patients, which is particularly useful in the event of acute or chronic intercurrent conditions [8]. To our knowledge, no data on the body composition of chronic hemodialysis patients by bioimpedance is available in Senegal. Thus, the aim of this study was to validate the use of bioelectric impedance analysis (BIA) in the assessment of water status and the estimation of dry weight in a Senegalese CHD patients population.
Study type and population
A cross-sectional, descriptive and analytical study over 9 weeks, from August 1 to September 31, 2017, targeted CHD patients at the Aristide Le Dantec University Hospital Center. The inclusion criteria had been: patients over 18 years of age, regularly dialysis for more than 3 months, with no history of hospitalization in the past month. All included patients were dialyzed with Nipro® machine (SURDIAL 55 PLUS model). The dialysate were composed of sodium 140 mmol / L, chlorine 109 mmol / L, calcium 1.50 mmol / L, bicarbonate 34 mmol / L, magnesium 0.5 mmol / L, potassium 2 mmol / L and glucose at 1 g / L. Patients who carried a medical implant (pacemaker, orthopedic nail, total hip replacement) and those who could not stand on the impedance scale were not included. Patients who missed at least 2 successive dialysis sessions and those who decided to withdraw from the study, were excluded from the study. Consent was obtained in all included patients. The study has received the approval of the Research Ethics Committee of the Cheikh Anta Diop University of Dakar.
Body water assessment
A single frequency bioelectric impedance foot-to-foot analyzer (Tanita®, model BC-730®, 50 kHz, Japan) was used. Measurements were made with patients standing barefoot on the metal side of the device and keeping their arms free and parallel to the body. The device assesses total body water (TBW) and body composition. Without modifying the clinically established dry weight, the weight and the TBW (TBWBIA, total body water measured at the BIA) were measured, before and after 6 successive hemodialysis sessions, i.e. 12 measurements for each patient. The TBW was also estimated using Watson’s equation [9] according to the following formulas: TBWWatson = 2.477 - (0.09516 x age) + (0.1074 x height) + (0.3362 x weight) for men; TBWWatson = −2.097 + (0.106 x height) + (0.2466 x weight) for women.
Statistical analysis
The data obtained from the BIA analyzer was compared with the results obtained from clinical measurements. Intragroup comparisons were made using a Student t-test with paired samples for repeated measurements. A Mann-Whitney u test, a Kuskal-Wallis test, a chi-square test associated with Cramer’s Phi V were used for the intergroup comparisons, according to the number of groups to be compared, the nature and the distribution of variables. TBWBIA was compared to TBWWatson using linear regression and Bland-Altman plots based on differences between TBW measurement methods. The significance level for all statistical tests was a p - value < 0.05. The data had been analyzed using SPSS® (Statistical Package for Social Sciences) Statistics version 25 (IBM® Corp., Armonk, New York, USA).
Two hundred and sixty-four measurements were obtained in 22 patients. The socio-demographic and clinical characteristics of the patients are summarized in table 1.
No patient was on diuretics. The TBW was significantly (p < 0.0001) higher in men than in women before and after the dialysis session. Significant reduction in weight (ΔWeight = 2.0 ± 1.1 kg) and TBW regardless of the measurement method (ΔTBWBIA = 3.3 ± 1.0 liters and ΔTBWWatson = 0.5 ± 0.2 liters) was observed (Table 2). There is no correlation between ΔWeight and ΔTBW (r = 0,078 and p = 0,730).
The linear correlations between TBWBIA and TBWWatson were highly significant for the measurements made before and after the dialysis session (Figure 1A and 1C). Before the session, the average difference between the two measurement methods was 0.5 ± 2.2 liters (p = 0.319). At the end of the session, the TBWWatson was significantly higher than the TBWBIA by 2.2 ± 1.9 liters (p < 0.0001). BlandAltman analysis (Figure 1B and 1D) showed a random dispersion of values around the mean with a bias of 0.5 (agreement limits of +4.8 to –3.9) before and from –2.2 (agreement limits from +1.5 to –5.9) after dialysis. For men, the bias was 1.2 (agreement limits from +5.3 to –2.8) before and –1.6 (agreement limits from +2.2 to –5.4) after dialysis. Among women, it was –0.4 (agreement limits from + 3.8 to –4.6) before and –2.9 (agreement limits from +0.4 to –6.2) after dialysis.
| Table 1: Baselines characteristics of the study population. | |
| Effective = 22 | |
| Men / women | 12 / 10 |
| Meanage (years) | 46,6 ± 13,1 |
| Mean duration of dialysis (months) | 92,3 ± 46,8 |
| Nephropathy(n) Vascular Glomerular Indeterminate Polycystickidneydisease |
10 6 5 1 |
| Mean dry weight (kg) | 62,7 ± 17,2 |
| Mean interdialytic weight gain (kg) | 1,6 ± 0,9 |
| Mean size (cm) | 171,8 |
| Mean BMI (kg / m2) | 21 ± 4,9 |
| Medianresidual diuresis (ml / day) | 50 |
| Mean number of antihypertensive treatments | 1,9 ± 1,1 |
| Table 2: Weight, water and blood pressure changes. | ||||
| Before | After | % variation | p | |
| Weight (kg) | 65,0 ± 17,1 | 62,9 ± 17,0 | –3,2 ± 1,4 % | 0,000 |
| TBWBIA (%weight) | 57,7 ± 10,9 | 54,1 ± 10,3 | –6,2 ± 3,3 % | 0,000 |
| TBWBIA (l) | 36,3 ± 7,1 | 33,0 ± 6,8 | –9,1 ± 2,9 % | 0,000 |
| TBWWatson (l) | 35,8 ± 6,9 | 35,2 ± 6,8 | –1,7 ± 0,8 % | 0,000 |
| SBP (mmHg) | 152 ± 21,7 | 154,9 ± 26,4 | 0,7 ± 8,1 % | 0,768 |
| DBP (mmHg) | 90,1 ± 13,6 | 89,6 ± 12,6 | –0,9 ± 9,2 % | 0,356 |
| TBWBIA: Total Body Water measured by BIA; TBWWatson: Total Body Water measured by Watson; SBP: Systolic Blood Pressure; DBP: Diastolic Blood Pressure. | ||||
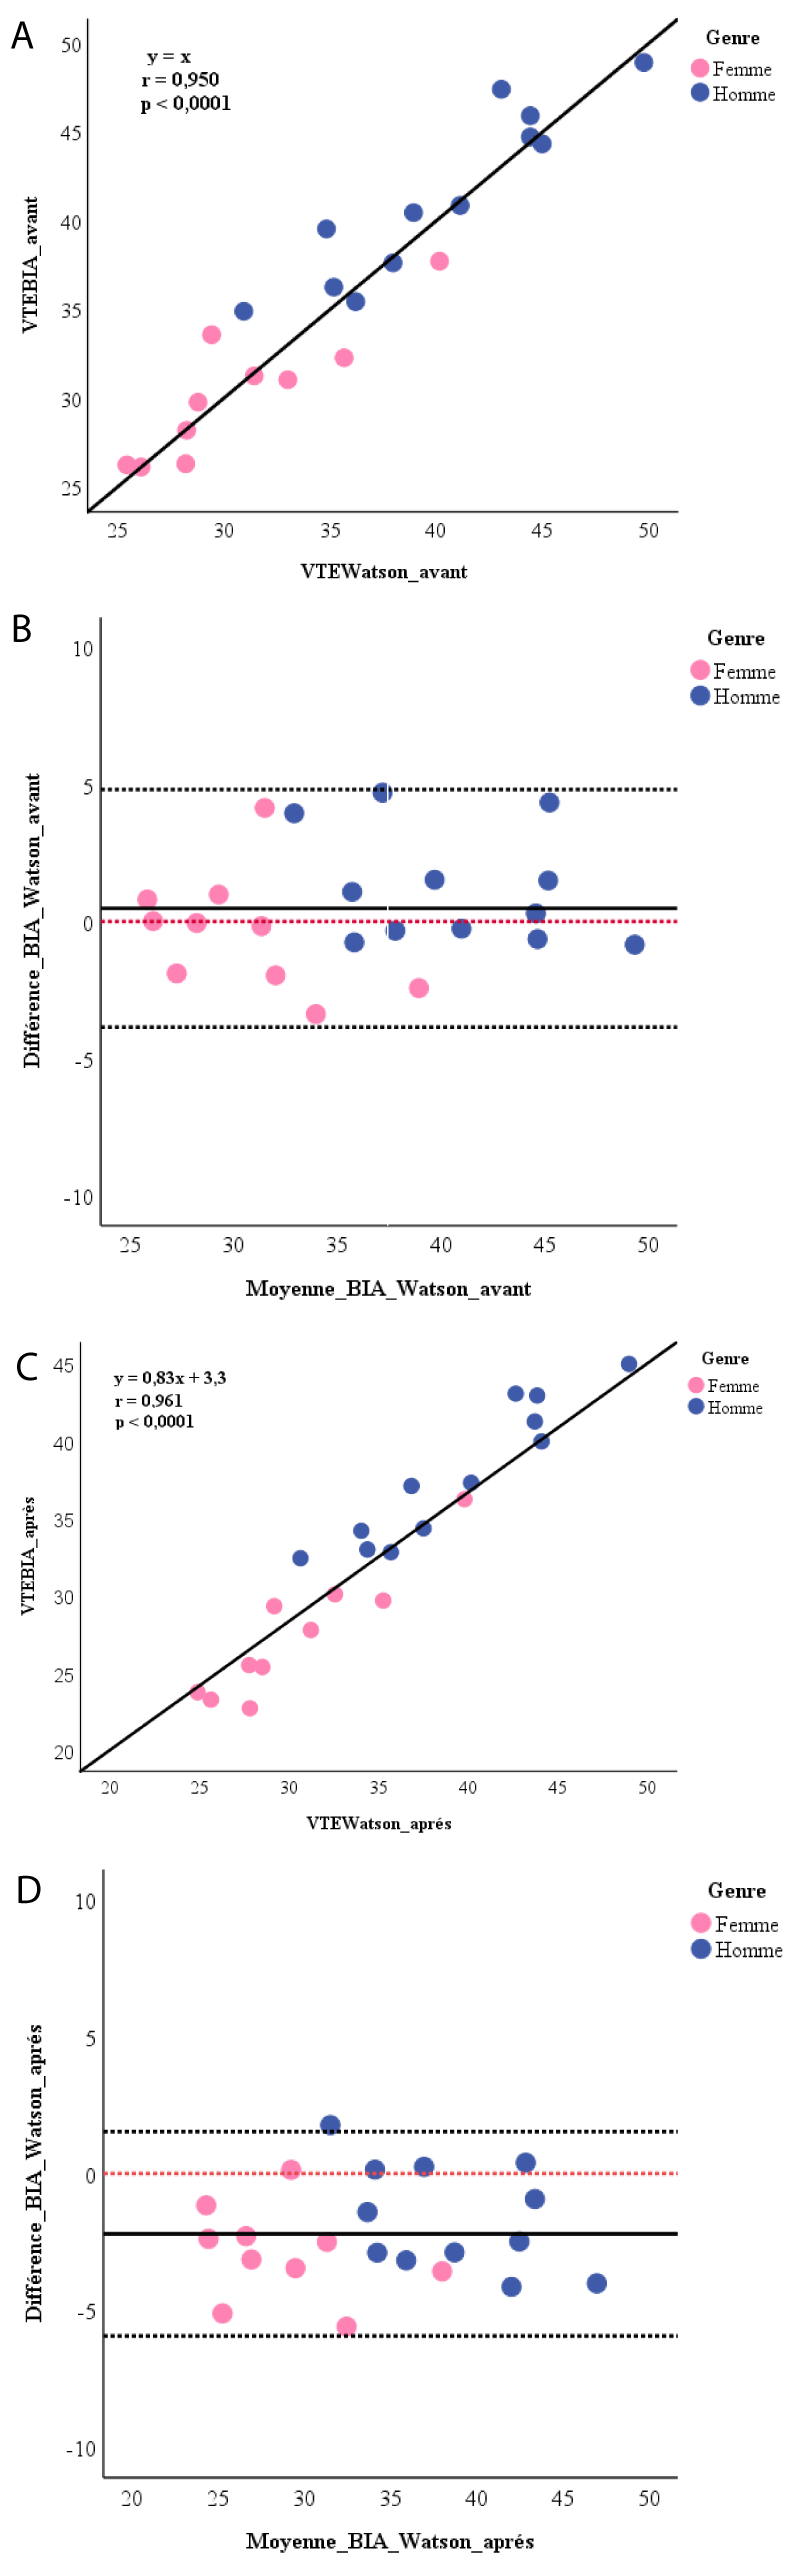
Figure 1: A) Linear correlation between Watson’s equation and BIA for calculating the total body water before dialysis session; B) Bland-Altman plot for total body water after dialysis session. ------:reference line at 0; C) Linear correlation between Watson’s equation and BIA for calculating total body water after dialysis; D) Bland-Altman plot for the total body water after dialysis session. ------:reference line at 0.
Water state and dry weight determination are performed daily on hemodialysis. Several monocentric studies have been published [10-12] to validate the use of the BIA “foot-hand” [11,13] or “foot-foot” [10] in determining the dry weight of CHD patients. In this work, a total of 264 bioimpedance measures were obtain. The patient’s weight was stable during the study period and the measurements by the BIA were reproducible. TBWBIA and TBWWatson decreased from the beginning to the end of dialysis sessions. In fact, in the CHD patient, there is a cyclic variation in the state of hydration. The TBW is maximum before dialysis session, then it decreases rapidly during treatment to reach its minimum value at the end of the session, and then it increases gradually during the interdialytic period [10,11,14,15]. This is a reliable criterion because we guess that the impedance of our patients was always higher at the end of dialysis session than at the beginning. In fact, the electrical conduction decreased when there is less water. Di Iorio et al. noted that the BIA variables (resistance and reactance) fluctuated considerably, with the highest values immediately after the session [16]. Similarly, in the follow-up, all patients had a significant reduction in weight. However, changes in weight in our patients were not predicted by changes in TBW. Same remark was made [11]. We concluded that in a clinical setting requiring knowledge of the patient’s water balance and where the patient cannot be weighed correctly, BIA alone, although easy to perform, may not provide accurate information.
The comparison of the TBWBIA through its embedded software and TBWWatson which uses anthropometric parameters, found a linear correlation between the two values. These results confirm those reported by Dodanio et al. who had noted this correlation for both the Single-Frequency (SF) BIA and the Multi-Frequency (MF) BIA [13] using the Chertow regression equations as an anthropometric formula [17]. Chertow equations were developed and established for CHD patients using impedance measurements. This is why in our study, we did not use them as a reference to validate our impedance measurements. Watson’s equation is a widely used estimation method because it has already shown valid measurements of TBW in CHD patients under dry weight conditions and it is used by dialysis machines to calculate the volume of distribution [11]. Furthermore, we found that this correlation between TBWBIA and TBWWatson was very strong before the session with the slope of their relationship to 1 (y = x). In addition there was no difference between TBWBIA and TBWWatson and the average of their differences was close to zero with a random distribution of points around this difference. There is therefore a strong correlation and good agreement between these two pre-dialysis measures. However, the 95% agreement limits (including 95% of patients) found in our study were wide. In post-dialysis, although we have always found a strong linear correlation, the concordance plot indicated a statistically significant difference between the values of TBWWatson and TBWBIA with the mean of the differences far from zero as well as wide agreement limits. Thus, the BIA allowed us to have accurate measurements of the TBW in pre-dialysis but the accuracy was less. She tends to underestimate it by 2.2 units compared to Watson’s equation in post-dialysis. Dodanio et al. found a strong linear correlation between the TBW values estimated anthropometrically and those measured with both the SF-BIA (r = 0.967) and the MF-BIA (r = 0.971) in pre-dialysis [13]. On the other hand, they found a statistically significant difference between the anthropometric measurements of the TBW and those of both the SF-BIA (bias at +1.72 liters; p < 0.01) and the MF-BIA (bias at + 1.67 liters; p < 0.01) with very wide concordance ranges (10.7 and 8.27 liters respectively). Similarly, at the end of the hemodialysis session and up to 120 minutes later, Di Iorio, et al. found that TBWBIA was similar to TBWWatson but not significantly and, conversely, when patients were overweight, the BIA significantly overestimated the values of Watson’s estimate [16]. It should be noted that Dodanio, et al. had performed the measurements in a single mid-week hemodialysis session [13] and Di Iorio, et al. during the last session of the week [16], while each of our patients had 12 measurements over 6 successive sessions, over 2 weeks. In addition Di Iorio, et al. selected patients with stable water status clinically and paraclinically [16]. We noted the influence of gender in the concordance of the impedance and anthropometric measurements of the TBW with a more accurate concordance in women.
As expected, this study has its limitations: the monocentric design, with a small cohort and a nonhomogeneous sample. The single frequency measurement technique offered by the analyzer was too simplified and could limit its use in CHD patients due to their pathological conditions. In addition, it should be noted that this impedance tool has been calibrated in healthy subjects. The measurement biases were marked by the fact that the patients could eat and drink during the session. We also did not take into account the influence of changes in body position, environmental conditions and body temperature.
These results underline the reproducibility, reliability and repeatability of impedance measurements in our chronic hemodialysis patients. They demonstrate the usefulness of a foot-to-foot BIA analyzer to assess the water status in a population of chronic hemodialysis patients in Senegal. The BIA allowed a fair estimate of the total body water prior to dialysis and would tend to underestimate Watson’s equation by 2.2 units in post-dialysis.
- Wizemann V, Wabel P, Chamney P, Zaluska W, Moissl U, et al. The mortality risk of overhydration in haemodialysis patients. Nephrol Dial Transplant. 2009: 24: 1574-1579. PubMed: https://pubmed.ncbi.nlm.nih.gov/19131355/
- Dou Y, Cheng X, Liu L, Bai X, Wu L, et al. Development and validation of a new dry weight estimation method using single frequency bioimpedance in hemodialysis patients. Blood Purif. 2011; 32: 278– 285. PubMed: https://pubmed.ncbi.nlm.nih.gov/21876350/
- Ozkahya M, Ok E, Toz H, Asci G, Duman S, et al. Long-term survival rates in haemodialysis patients treated with strict volume control. Nephrol Dial Transplant. 2006; 21: 3506–3513. PubMed: https://pubmed.ncbi.nlm.nih.gov/17000733/
- Moissl UM, Wabel P, Chamney PW, Bosaeus I, Levin NW, et al. Body fluid volume determination via body composition spectroscopy in health and disease. Physiol Meas. 2006; 27: 921–933. PubMed: https://pubmed.ncbi.nlm.nih.gov/16868355/
- Chamney PW, Wabel P, Moissl UM, Müller MJ, Bosy-Westphal A, et al. A whole-body model to distinguish excess fluid from the hydration of major body tissues. Am J Clin Nutr. 2007; 85: 80–89. PubMed: https://pubmed.ncbi.nlm.nih.gov/17209181/
- Davies SJ, Garcia Lopez E, Woodrow G, Donovan K, Plum J, et al. Longitudinal relationships between fluid status, inflammation, urine volume and plasma metabolites of icodextrin in patients randomized to glucose or icodextrin for the long exchange. Nephrol Dial Transplant. 2008; 23: 2982 –2988. PubMed: https://pubmed.ncbi.nlm.nih.gov/18456678/
- Davies SJ, Davenport A. The role of bioimpedance and biomarkers in helping to aid clinical decision-making of volume assessments in dialysis patients. Kidney Int. 2014; 86: 489-496. PubMed: https://pubmed.ncbi.nlm.nih.gov/24918155/
- Kooman JP, Van Der Sande FM, Leunissen KM. Wet or dry in dialysis—can new technologies help? Semin Dial. 2009; 22: 9-12. PubMed: https://pubmed.ncbi.nlm.nih.gov/19250443/
- Watson PE, Watson ID, Batt RD. Total body water volumes for adult males and females estimated from simple anthropometric measurements. Am J Clin Nutr. 1980; 33: 27-39. PubMed: https://pubmed.ncbi.nlm.nih.gov/6986753/
- Cridlig J, Alquist M, Kessler M, Nadi M. Formulation of a dry weight bioimpedance index in hemodialysis patients. Int J Artif Organs. 2011; 34: 1075-1084. PubMed: https://pubmed.ncbi.nlm.nih.gov/22183521/
- Kurtin PS, Shapiro AC, Tomita H, Raizman D. Volume Status and Body Composition of Chronic Dialysis Patients: Utility of Bioelectric Impedance Plethysmography. Am J Nephrol. 1990; 10: 363-367. PubMed: https://pubmed.ncbi.nlm.nih.gov/2080787/
- Asmat H, Iqbal R, Sharif F, Mahmood A, Abbas A, et al. Validation of Bioelectrical Impedance Analysis for Assessing Dry Weight of Dialysis Patients in Pakistan. Saudi J Kidney Dis Transpl. 2017; 28: 285-291. PubMed: https://pubmed.ncbi.nlm.nih.gov/28352009/
- Donadio C, Consani C, Ardini M, BernabinI G, Caprio F, et al. Estimate of Body Water Compartments and of Body Composition in Maintenance Hemodialysis Patients: Comparison of Single and Multifrequency Bioimpedance Analysis. J Ren Nutr. 2005; 15: 332-344. PubMed: https://pubmed.ncbi.nlm.nih.gov/16007563/
- Maggiore Q, Nigrelli S, Ciccarelli C, Grimaldi C, Rossi GA, et al. Nutritional and prognostic correlates of bioimpedance indexes in hemodialysis patients. Kidney Int. 1996; 50: 2103–2108. PubMed: https://pubmed.ncbi.nlm.nih.gov/8943496/
- Piccoli A. Identification of operational clues to dry weight prescription in hemodialysis using bioimpedance vector analysis. Kidney Int. 1998; 53: 1036–1043. PubMed: https://pubmed.ncbi.nlm.nih.gov/9551415/
- Di Iorio BR, Scalfi L, Terracciano V, Bellizzi V. A systematic evaluation of bioelectrical impédance measurement after hemodialysis session. Kidney Int. 2004; 65: 2435–2440. PubMed: https://pubmed.ncbi.nlm.nih.gov/15149357/
- Chertow GM, Lazarus JM, Lew NL, MA L, Lowrie EG. Development of a population-specific regression equation to estimate total body water in hemodialysis patients. Kidney Int. 1997; 51: 1578-1582. PubMed: https://pubmed.ncbi.nlm.nih.gov/9150475/