
More Information
Submitted: February 16, 2024 | Approved: March 05, 2024 | Published: March 06, 2024
How to cite this article: Alruwaili AH, Alsaran KA, Alshathri AA. Assessment of the Quality of Life of the Caregiver of Pediatric Patients with Chronic Kidney Disease in a Tertiary Health Care Facility. J Clini Nephrol. 2024; 8: 032-038.
DOI: 10.29328/journal.jcn.1001123
Copyright License: © 2024 Alruwaili AH, et al. This is an open access article distributed under the Creative Commons Attribution License, which permits unrestricted use, distribution, and reproduction in any medium, provided the original work is properly cited.
Keywords: Chronic kidney disease; Dialysis; Caregivers; Psychosocial effects; Quality of life; Stress
Nonstandard Abbreviations: QOL: Quality of Life; PD: Peritoneal Dialysis; HD: Hemodialysis; CKD: Chronic Kidney Disease; HRQOL: Health-Related Quality of Life

Assessment of the Quality of Life of the Caregiver of Pediatric Patients with Chronic Kidney Disease in a Tertiary Health Care Facility
Asma Hamoud Alruwaili*, Khaled Abdulaziz Alsaran and Abdulaziz Abdullah Alshathri
Pediatric Nephrology Department, King Saud Medical City, Riyadh, Saudi Arabia
*Address for Correspondence: Dr. Asma Hamoud Alruwaili, Pediatric Nephrology Department, King Saud Medical City, Riyadh, Saudi Arabia, Email: [email protected]
Background: Long-term care for patients with chronic kidney disease, whether in the pre or post-dialysis period, has a destructive impact on patients and their caregivers that can significantly worsen their quality of life.
Objectives: To assess the quality of life (QOL) among caregivers of children suffering from chronic kidney disease and to identify the possible factors affecting their quality of life.
Subjects and methods: Between March 2023 and May 2023, a cross-sectional questionnaire-based study was conducted at King Saud Medical City for caregivers of all pediatric patients aged from 6 months to 14 years with CKD stage-3B and beyond who have been followed up for at least three months in the pre or post-dialysis period since 2015. The study applied the World Health Organization Quality of Life Questionnaire (WHOQOL-BREF) to evaluate the caregivers’ quality of life.
Result: A total of 95 caregivers were involved in the study. The age ranged between 24 and 53 years, with an arithmetic mean of 39.3 and a standard deviation of (± 6.6) years, and almost two-thirds (65.3%) were Saudi nationals. Most pediatric patients were on peritoneal renal dialysis (41%), whereas 29.5% were on hemodialysis. The mean and SD of the overall score was 56.10 ± 17.40 out of a possible range of 0-100. Regarding its domains, the highest score was observed regarding the social domain (62.11 ± 21.12), whereas the lowest was the physical domain (49.55 ± 18.42). After controlling for confounding, married, high socio-economic, and more educated caregivers have higher QOL scores than singles, low socio-economic, and lower knowledgeable caregivers, and the three factors together were responsible for approximately 41% variability of the QOL score (r – square = 0.406). Bivariate Pearson correlation showed significant correlations among different quality-of-life domains (p < 0.001).
Conclusion: There was a significant association between quality-of-life scores and demographic characteristics of chronic kidney disease caregivers; they need the highest support to cope with their delicate patients.
Chronic kidney disease is one of the leading health problems in the world and has a significant effect on morbidity and mortality in pediatric patients [1-3]. It is defined as the presence of structural or functional kidney damage (even if the value is greater than 60 mL/min/1.73 m2) for at least three months [4]. Chronic disease affects patients, their families, and caregivers [5]. There are many treatment methods as kidney replacement therapy for chronic kidney failure, among which hemodialysis is the most common [6].
Currently, there are two main options available for patients who are not able to receive a kidney transplant - Peritoneal Dialysis (PD) and Hemodialysis (HD) [7]. Although HD is the most used dialysis method worldwide, especially in developed countries, PD is becoming increasingly popular in middle and low-income countries due to its cost-effectiveness [7-9]. PD is a home-based modality that provides children more chances to participate in activities and school attendance; both dialysis modalities are considered as a bridge to kidney transplants for patients [10]. Patients on dialysis must make significant changes to their lifestyles regarding their diet, daily routines, mental health, physical activity, and social/family relationships because of the restrictions associated with the procedure itself [10,11].
In many developing countries, people who are undergoing dialysis depend on a primary caregiver to provide them with care and support [12]. This caregiver is usually an adult relative or neighbor who provides practical day-to-day assistance without receiving any payment [12]. Studies have revealed that individuals responsible for patients receiving dialysis require adequate knowledge, skills, and guidance to provide appropriate care [13,14] because dialysis treatment involves a comprehensive set of therapeutic measures. Providing care can be a chronic source of stress for caregivers due to the heavy emotional burden and physically demanding activities involved. The logistics of managing symptoms and treatment associated with the dialysis process, such as transportation to the dialysis unit, frequent hospital visits, nutrition, personal hygiene support, and medications, can significantly impact the caregiver’s quality of life [10,15,16]. Also, they may need to travel long distances to attend their clinic visits and dialysis sessions and bear the costs of their obligations [17].
Caring for a sick family member daily and long-term can pose health risks for caregivers, especially when only one person is responsible for the care. On the other hand, caregivers of patients with primary progressive disease require more teaching and training and may need to manage further difficulties and complications [18]. Long-term caregiving can lead to dissatisfaction, worry, and guilt for caregivers. Furthermore, caring for patients with chronic dialysis may negatively affect family relationships and socio-economic status, which could seriously impact the quality of life. All these factors can increase the pressure experienced by caregivers. Despite increased research on health-related quality of life (HRQOL) and CKD in children, few quantitative tools have been available to assess caregiver experience [19,20-24]. Supportive psychosocial interventions should be available to improve the well-being and quality of life of caregivers and their patients throughout this chronic illness journey [25]. Therefore, medical and psychosocial aspects are needed to ascertain proper care for pediatric CKD patients and their caregivers [25]. Caregivers should have a chance to express their everyday struggles, fears, and concerns; that can help them deal with their emotions and facilitate acceptance of their situation [26]. Psychosocial issues reported by the child and parents or elicited by the clinician help determine the key areas to be addressed [27-28]. For that, our study aims to assess the quality of life of caregivers of pediatric patients with chronic kidney disease in King Saud Medical City, a tertiary hospital in Riyadh, Saudi Arabia.
A questionnaire-based study was conducted in King Saud Medical City, Riyadh, Saudi Arabia, in the Department of Pediatric Nephrology, recruited caregivers of all pediatric patients with (CKD stage-3B and beyond), aged from 6 months to 14 years, whether in the pre-or post-dialysis period, for at least three months, who were followed up at King Saud Medical City since 2015, from March 2023 to May 2023.
The Research Center Committee and the Institutional Review Board at King Saud Medical City authorized and approved this research study (H1R1-13-Nov22-01). Only volunteers who provided written informed consent and verbal permission were included in the study. A total of 95 caregivers were identified as possible participants in the study. Children whose parents declined to participate were excluded. Data were collected through hospital visits, over the telephone, and an online questionnaire. Caregivers were classified into three groups based on pre and post-dialysis, including HD and PD. We collected data on demographic variables and family relationships. The quality of life of caregivers was evaluated using the WHOQOL-Bref Scores. This 26-item self-administered generic questionnaire can be analyzed from four domains: physical health, psychological health, social relations, and environment.
Statistical analysis
The Statistical Package for Social Sciences (SPSS) version 28.0 was used for data entry and statistical analysis. Frequency and percentage were used to describe categorical variables, while arithmetic mean and standard deviation (SD) were used for numerical variables. Independent two-sample t-test was used to compare the means of a continuous variable between two groups. On the other hand, one-way analysis of variance (ANOVA) and its post-hoc Tukey’s test were used to compare the means of a continuous variable between more than two groups. Multiple linear regression was used to identify QOL predictors among caregivers, and a p-value of <0.05 was considered a cut-off level for statistical significance.
The present study included 95 female caregivers whose sociodemographic characteristics are summarized in Table 1. The age of the participants reached between 24 and 53 years, with an arithmetic mean of 39.3 years and a standard deviation of ± 6.6 years. Most participants (80%) were married, and almost two-thirds (65.3%) were Saudi nationals. About one-third of the participants (32.6%) had completed primary school education, while 29.5% had a college or higher education. More than half of the participants (52.6%) had a low socioeconomic status.
| Table 1: Sociodemographic characteristics of the caregivers (n = 95). | ||
| Variables | Frequency | Percentage |
| Nationality | ||
| Saudi Non-Saudi |
62 33 |
65.3 34.7 |
| Age (years) | ||
| Range Mean ± SD |
24 - 53 39.3 ± 6.6 |
|
| Marital status | ||
| Single Married Divorced Widowed |
8 76 9 2 |
8.4 80.0 9.5 2.1 |
| Educational level | ||
| Able to read and write Primary school/intermediate school secondary school College/above |
10 31 26 28 |
10.5 32.6 27.4 29.5 |
| Socioeconomic status | ||
| Low Moderate High |
50 44 1 |
52.6 46.3 1.1 |
Most pediatric patients were on peritoneal renal dialysis (41%), whereas 29.5% were on hemodialysis Figure 1.
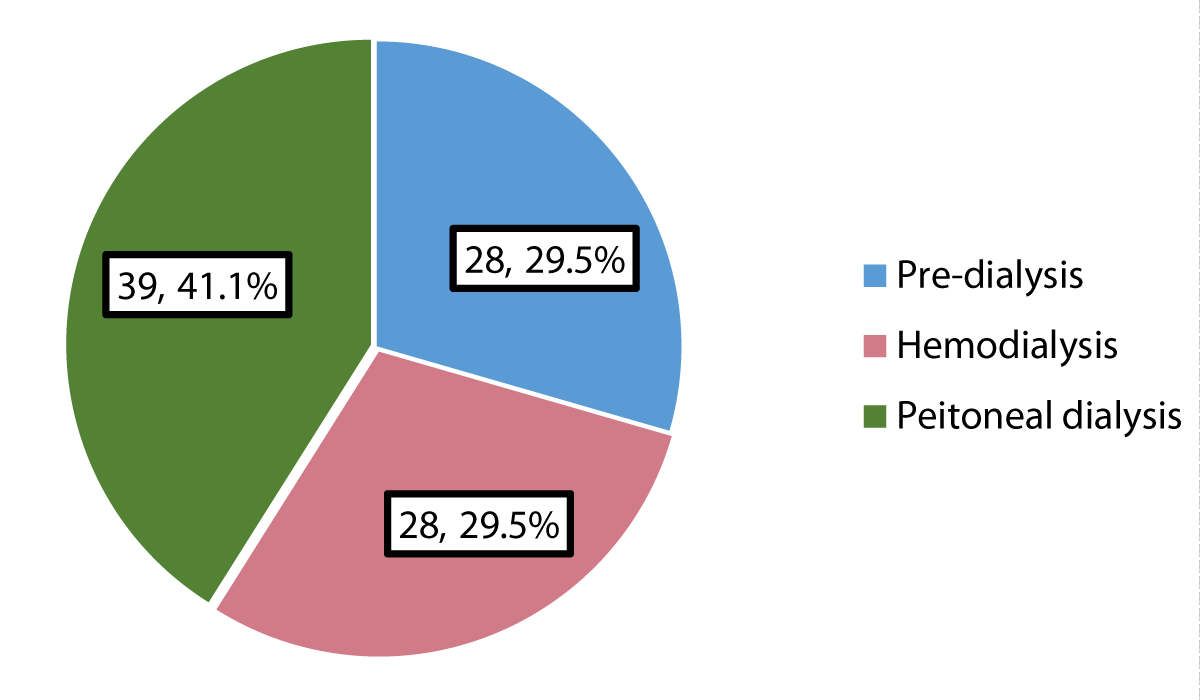
Figure 1: Patients` health status.
Quality of life
The mean and standard deviation of the caregivers` overall quality of life score and its domains were summarized in Table 2. The mean and SD of the overall score was 56.10 ± 17.40 out of a possible range of 0-100. Regarding its domains, the social domain had the highest score (62.11 ± 21.12), whereas the lowest was the physical domain (49.55 ± 18.42).
| Table 2: Description of the overall quality of life and its domains among caregivers. | |
| Mean ± SD | |
| Physical domain | 49.55 ± 18.42 |
| Psychological domain | 58.82 ± 20.49 |
| Social domain | 62.11 ± 21.12 |
| Environmental domain | 57.53 ± 19.68 |
| Overall perception of general health | 56.84 ± 26.15 |
| Overall perception of quality of life | 52.37 ± 26.57 |
| Overall quality of life | 56.10 ± 17.40 |
| SD: Standard Deviation | |
Factors associated with caregivers` quality of life
Caregiver`s nationality: The overall quality-of-life score in most domains was significantly higher in Saudi than in non-Saudi caregivers Table 3.
| Table 3: Description of overall quality of life score and its domains among caregivers, according to their nationality. | |||
| Saudi N = 62 Mean ± SD |
Non-Saudi N = 33 Mean ± SD |
p - value* | |
| Physical domain | 50.92 ± 18.96 | 46.97 ± 17.34 | 0.322 |
| Psychological domain | 60.95 ± 20.79 | 54.80 ± 19.60 | 0.164 |
| Social domain | 65.59 ± 22.0 | 55.56 ± 17.88 | 0.027 |
| Environmental domain | 63.0 ± 18.87 | 47.25 ± 17.08 | <0.001 |
| Overall perception of general health | 58.47 ± 25.58 | 53.79 ± 27.33 | 0.409 |
| Overall perception of quality of life | 59.68 ± 23.24 | 38.64 ± 27.31 | <0.001 |
| Overall quality of life | 59.29 ± 17.70 | 50.09 ± 15.35 | 0.013 |
| SD: Standard Deviation; Independent two-sample t - test | |||
Caregiver`s marital status: The social domain and overall quality of life scores were highest among married caregivers and lowest among divorced/widowed caregivers, with p = 0.027 and p = 0.013, respectively. The environmental domain and overall perception of quality-of-life scores were highest among singles and lowest among divorced/widowed caregivers, p < 0.001 Table 4.
| Table 4: Description of overall quality of life score and its domains among caregivers, according to their marital status. | ||||
| Single N = 8 Mean ± SD |
Married N = 76 Mean ± SD |
Divorced/Widowed N = 11 Mean ± SD |
p - valueⱶ | |
| Physical domain | 50.0 ± 24.89 | 50.61 ± 17.95 | 41.88 ± 16.30 | 0.322 |
| Psychological domain | 61.46 ± 24.98˚ | 61.68 ± 18.94* | 37.12 ± 15.30˚* | 0.164 |
| Social domain | 62.50 ± 15.43 | 64.80 ± 20.35˚ | 43.18 ± 21.67˚ | 0.027 |
| Environmental domain | 60.16 ± 22.70 | 58.92 ± 19.38 | 46.02 ± 17.24 | < 0.001 |
| Overall perception of general health | 62.50 ± 29.88 | 59.21 ± 25.11˚ | 36.36 ± 23.35˚ | 0.409 |
| Overall perception of quality of life |
56.25 ± 25.88 | 54.61 ± 26.05˚ | 34.09 ± 25.67˚ | < 0.001 |
| Overall quality of life |
57.81 ± 18.84 | 57.92 ± 16.94˚ | 42.23 ± 14.39˚ | 0.013 |
| SD: Standard Deviation; ⱶOne-way analysis of variance (ANOVA) test; ˚, *: p < 0.05 (Post-hoc Tukey `s test) |
||||
Caregiver`s educational level: The overall quality of life score and most domains were significantly higher in the highest-educated than lowest-educated caregivers, as illustrated in Table 5.
| Table 5: Description of overall quality of life score and its domains among caregivers, according to their educational level. | ||||
| Below secondary N = 41 Mean ± SD |
Secondary N = 26 Mean ± SD |
College/above N = 28 Mean ± SD |
p - valueⱶ | |
| Physical domain | 41.90 ± 18.02˚* | 52.47 ± 16.34˚ | 58.04 ± 16.77* | 0.001 |
| Psychological domain | 53.25 ± 19.95 | 63.46 ± 19.09 | 62.65 ± 21.26 | 0.068 |
| Social domain | 56.30 ± 20.31 | 68.27 ± 22.24 | 64.88 ± 19.69 | 0.053 |
| Environmental domain | 47.94 ± 18.48˚* | 62.38 ± 18.40˚ | 67.08 ± 16.48* | < 0.001 |
| Overall perception of general health | 48.78 ± 29.55˚ | 62.50 ± 23.72 | 63.39 ± 19.82˚ | 0.030 |
| Overall perception of quality of life |
43.90 ± 27.83˚ | 53.85 ± 27.10 | 63.39 ± 19.82˚ | 0.009 |
| Overall quality of life |
48.55 ± 16.84˚* | 60.50 ± 16.29˚ | 63.06 ± 15.25* | 0.001 |
| SD: Standard deviation ⱶOne-way analysis of variance (ANOVA) test; ˚, *: p < 0.05 (Post-hoc Tukey `s test). |
||||
Caregiver`s socioeconomic status: The overall quality of life score and its domain scores (physical health, psychological health, environmental health, social health, perception of general health, and perception of quality of life) were significantly higher in caregivers of moderate to high socioeconomic status than those of low socioeconomic status Table 6.
| Table 6: Description of overall quality of life score and its domains among caregivers, according to their socioeconomic status. | |||
| Low N = 50 Mean ± SD |
Moderate/high N = 45 Mean ± SD |
p - valueⱶ | |
| Physical domain | 42.43 ± 17.79 | 57.46 ± 15.84 | < 0.001 |
| Psychological domain | 49.83 ± 19.71 | 68.79 ± 16.47 | < 0.001 |
| Social domain | 45.50 ± 14.94 | 70.80 ± 15.20 | < 0.001 |
| Environmental domain | 51.83 ± 19.58 | 73.52 ± 16.50 | < 0.001 |
| Overall perception of general health | 48.0 ± 25.67 | 66.67 ± 23.23 | < 0.001 |
| Overall perception of quality of life | 38.0 ± 23.28 | 68.33 ± 20.23 | < 0.001 |
| Overall quality of life | 46.48 ± 14.92 | 66.78 ± 13.30 | < 0.001 |
| SD: Standard Deviation; ⱶ Independent two-sample t-test | |||
Patient’s health status: As shown in Table 7, there was no significant difference between patients in predialysis status and those undergoing hemodialysis or peritoneal dialysis as regards the caregivers` quality of life and its domains.
| Table 7: Description of overall quality of life score and its domains among caregivers, according to the patient's health status. | ||||
| Pre-dialysis N = 28 Mean ± SD |
Hemodialysis N = 28 Mean ± SD |
Peritoneal dialysis N = 39 Mean ± SD |
p - valueⱶ | |
| Physical domain | 49.87 ± 22.53 | 49.11 ± 19.36 | 49.63 ± 14.56 | 0.988 |
| Psychological domain | 58.33 ± 23.68 | 58.48 ± 20.49 | 59.40 ± 18.48 | 0.974 |
| Social domain | 58.04 ± 22.84 | 53.91 ± 19.67 | 59.78 ± 17.24 | 0.483 |
| Environmental domain | 67.56 ± 24.04 | 59.23 ± 22.49 | 60.26 ± 17.36 | 0.263 |
| Overall perception of general health | 56.25 ± 33.76 | 57.14 ± 23.43 | 57.05 ± 22.18 | 0.990 |
| Overall perception of quality of life | 50.89 ± 30.03 | 48.21 ± 25.39 | 56.41 ± 24.81 | 0.438 |
| Overall quality of life | 56.92 ± 20.34 | 54.32 ± 17.90 | 56.78 ± 14.97 | 0.815 |
| SD: Standard Deviation; ⱶOne-way analysis of variance (ANOVA) test | ||||
Correlation between different domains of quality of life
Bivariate Pearson correlation showed significant correlations among other quality-of-life domains (p < 0.001) Table 8.
| Table 8: Correlations between different domains of quality of life among caregivers. | ||||||
| Overall perception of general health | Overall perception of QOL |
Physical health |
Psychological health |
Environmental health |
Social health |
|
| Overall perception of general health | ||||||
| Overall perception of QOL | r = 0.570 p < 0.001 | |||||
| Physical health | r = 0.663 p < 0.001 | r = 0.540 p < 0.001 | ||||
| Psychological health | r = 0.666 p < 0.001 | r = 0.533 p < 0.001 | r = 0.783 p < 0.001 | |||
| Environmental health | r = 0.512 p < 0.001 | r = 0.786 p < 0.001 | r = 0.728 | r = 0.705 p < 0.001 | ||
| Social Health | r = 0.478 p < 0.001 | r = 0.604 p < 0.001 | r = 0.575 p < 0.001 | r = 0.594 p < 0.001 | r = 0.678 p < 0.001 | |
| r: Pearson correlation | ||||||
Multiple linear regression
As shown in Table 9, after control for confounding, married, high socio-economic, and more educated caregivers had higher QOL scores compared to singles, low socioeconomic, and lower knowledgeable caregivers, and the three factors together were responsible for approximately 41% variability of the QOL score (r-square = 0.406).
| Table 9: Best fitting multiple linear regression model for quality of life score among caregivers. | |||||||
| Unstandardized Coefficients |
Standardized Coefficients |
t - test | p - value | 95% Confidence Interval for B |
|||
| B | Std. Error | Lower | Upper | ||||
| Constant | 37.496 | 8.206 | 4.568 | < 0.001 | 21.19 | 53.80 | |
| Marital status (reference: single) | -6.554 | 3.157 | -0.169 | 2.076 | 0.041 | -12.83 | -0.28 |
| Socioeconomic status (reference: low) | 17.138 | 3.010 | 0.494 | 5.693 | < 0.001 | 11.16 | 23.12 |
| Educational level (reference: below secondary) | 2.739 | 1.146 | 0.206 | 2.391 | 0.019 | 0.46 | 5.02 |
| R-square = 0.406, Adjusted R2 = 0.387 Model ANOVA: F = 20.746, p < 0.001 Variables entered and excluded: nationality. | |||||||
Caregiver nationality was not significantly associated with QOL.
Pediatric patients with chronic kidney diseases need hemodialysis or peritoneal dialysis, which are considered very invasive and costly regular therapies, thus impacting the psychosocial status of both patients and their family caregivers [29]. The current study focused on caregivers and their aspects of life, showing that the caregiver’s entity is as vital as the patient.
In the present study, more than half of caregivers have a low socio-economic status. The same has been reported by Alnjadat [30] and Abd El-Azem, et al. [29], who noted that most Malaysian and Egyptian caregivers of cancer patients were of low socioeconomic status.
Most studies assessed the quality of life among caregivers of patients with chronic kidney disease, whether on hemodialysis or peritoneal dialysis; the present study showed that caregivers had a significantly poor quality of life [29,31-34].
The mean and SD of the overall caregiver` QOL score was 56.10 ± 17.40 out of a possible range of 0-100. Regarding its domains, the highest score was observed regarding the social domain, whereas the lowest score was observed regarding the physical domain. In other studies in Egypt [29] and Ghana [35], the lowest mean score was for the spiritual domain, while the highest was for the environmental domain. In Brazil [36], the physical and social relations domains showed the highest scores (66.7 and 60.9, respectively), while the environmental domain showed the lowest scores (52.5). These differences in the results between studies could be attributed to a variety of cultures in looking for the meaning of quality of life as well as the differences in characteristics of included caregivers and their socioeconomic status, and finally, the difference in measurement tools used to assess QOL.
As reasonably expected, the social domain score and the overall quality of life score were highest among married caregivers and lowest among divorced/widowed caregivers. Others have observed the same [29,31].
Observing that social domain score, environmental domain score, and overall quality of life score were considerably higher in Saudi than non-Saudi caregivers is also expected and could be attributed to family support, which is supposed to be stronger for nationals than non-nationals.
The present study’s physical health domain, environmental health domain, overall perception of general health, overall perception of quality of life, and overall quality of life were higher in the highest educated (college/above) than lowest educated caregivers (below secondary school) caregivers. This might be attributed to the fact that they are more aware of the situation and outcomes. The same has been reported by Abd El-Azem, et al. in Egypt [29].
In the present study, the overall quality of life score and those of its different domains were higher in caregivers of moderate to high socioeconomic status than those of low socioeconomic status. This could be attributed to the fact that all family caregivers in the present study were women, and the family toilers in most Saudi families are fathers. Similarly, in studies in Egypt [29] and Indonesia [37], the family’s socioeconomic status was a significant predictor for caregivers` QOL. At the same time, Vanz, et al. [38] evaluated the quality of life in 27 caregivers of children and adolescents with osteogenesis imperfecta in Spain. They found contracted results that there was no significant correlation between the economic status of family caregivers and their QOL.
The current study showed no difference regarding caregivers` QOL between patients in pre-dialysis status and those undergoing hemodialysis or peritoneal dialysis. However, some studies showed that the quality of life was significantly better in caregivers whose patients were not yet on dialysis [39] and others reported good quality of life in PD patients compared to the HD group [40].
This study has some limitations, including the fact that the possible causes of poor QOL cannot be determined as the study was cross-sectional and conducted in one center; thus, the generalizability of findings over other centers needs to be revised. In addition, misinterpretations of some questions can affect the responses and could have changed if male caregivers had been included as participants. Therefore, some results may have been affected. Despite those limitations, the study explored a critical social issue in our community: the QOL of caregivers should be considered as crucial as the QOL of patients themselves.
This study supported previous studies that spotlight the impact of chronic kidney disease on the caregivers` quality of life. The highest score was observed in the social domain, whereas the lowest was in the physical domain. Married, highly socioeconomic, and educated caregivers have higher QOL scores than single, low socioeconomic, and less knowledgeable caregivers. However, there was no difference between patients in predialysis status and those undergoing hemodialysis or peritoneal dialysis as regards the caregivers` quality of life. Based on the current study results, this group needs more attention and focus on solving their psychosocial challenges to be able to deal with their sick children and help them overcome their condition. In addition, organizing social and psychological programs for caregivers of such patients is mandatory before starting dialysis sessions to be ready to perform their tasks. Finally, further multi-centric study with a larger sample size is needed to have a clearer image of the situation in our community.
The authors are grateful to all caregivers who participated in this study.
- Malas MB, Canner JK, Hicks CW, Arhuidese IJ, Zarkowsky DS, Qazi U, Schneider EB, Black JH 3rd, Segev DL, Freischlag JA. Trends in incident hemodialysis access and mortality. JAMA Surg. 2015 May;150(5):441-8. doi: 10.1001/jamasurg.2014.3484. PMID: 25738981.
- Ko GJ, Rhee CM, Obi Y, Chang TI, Soohoo M, Kim TW, Kovesdy CP, Streja E, Kalantar-Zadeh K. Vascular access placement and mortality in elderly incident hemodialysis patients. Nephrol Dial Transplant. 2020 Mar 1;35(3):503-511. doi: 10.1093/ndt/gfy254. PMID: 30107612; PMCID: PMC7057539.
- Napalkov P, Felici DM, Chu LK, Jacobs JR, Begelman SM. Incidence of catheter-related complications in patients with central venous or hemodialysis catheters: a health care claims database analysis. BMC Cardiovasc Disord. 2013 Oct 16;13:86. doi: 10.1186/1471-2261-13-86. PMID: 24131509; PMCID: PMC4015481.
- Dugué AE, Levesque SP, Fischer MO, Souweine B, Mira JP, Megarbane B, Daubin C, du Cheyron D, Parienti JJ; Cathedia Study Group. Vascular access sites for acute renal replacement in intensive care units. Clin J Am Soc Nephrol. 2012 Jan;7(1):70-7. doi: 10.2215/CJN.06570711. Epub 2011 Nov 10. PMID: 22076877; PMCID: PMC3265351.
- O'Grady NP, Alexander M, Burns LA, Dellinger EP, Garland J, Heard SO, Lipsett PA, Masur H, Mermel LA, Pearson ML, Raad II, Randolph AG, Rupp ME, Saint S; Healthcare Infection Control Practices Advisory Committee (HICPAC). Guidelines for the prevention of intravascular catheter-related infections. Clin Infect Dis. 2011 May;52(9):e162-93. doi: 10.1093/cid/cir257. Epub 2011 Apr 1. PMID: 21460264; PMCID: PMC3106269.
- Weijmer MC, Vervloet MG, ter Wee PM. Compared to tunnelled cuffed haemodialysis catheters, temporary untunnelled catheters are associated with more complications already within 2 weeks of use. Nephrol Dial Transplant. 2004 Mar;19(3):670-7. doi: 10.1093/ndt/gfg581. PMID: 14767025.
- Klouche K, Amigues L, Deleuze S, Beraud JJ, Canaud B. Complications, effects on dialysis dose, and survival of tunneled femoral dialysis catheters in acute renal failure. Am J Kidney Dis. 2007 Jan;49(1):99-108. doi: 10.1053/j.ajkd.2006.09.014. PMID: 17185150.
- Lawson JH, Niklason LE, Roy-Chaudhury P. Challenges and novel therapies for vascular access in haemodialysis. Nat Rev Nephrol. 2020 Oct;16(10):586-602. doi: 10.1038/s41581-020-0333-2. Epub 2020 Aug 24. PMID: 32839580; PMCID: PMC8108319.
- Clark EG, Barsuk JH. Temporary hemodialysis catheters: recent advances. Kidney Int. 2014 Nov;86(5):888-95. doi: 10.1038/ki.2014.162. Epub 2014 May 7. PMID: 24805107; PMCID: PMC4220490.
- Lok CE, Huber TS, Lee T, Shenoy S, Yevzlin AS, Abreo K, Allon M, Asif A, Astor BC, Glickman MH, Graham J, Moist LM, Rajan DK, Roberts C, Vachharajani TJ, Valentini RP; National Kidney Foundation. KDOQI Clinical Practice Guideline for Vascular Access: 2019 Update. Am J Kidney Dis. 2020 Apr;75(4 Suppl 2):S1-S164. doi: 10.1053/j.ajkd.2019.12.001. Epub 2020 Mar 12. Erratum in: Am J Kidney Dis. 2021 Apr;77(4):551. PMID: 32778223.
- Al-Jaishi AA, Lok CE, Garg AX, Zhang JC, Moist LM. Vascular access creation before hemodialysis initiation and use: a population-based cohort study. Clin J Am Soc Nephrol. 2015 Mar 6;10(3):418-27. doi: 10.2215/CJN.06220614. Epub 2015 Jan 7. PMID: 25568219; PMCID: PMC4348683.
- Parienti JJ, Thirion M, Mégarbane B, Souweine B, Ouchikhe A, Polito A, Forel JM, Marqué S, Misset B, Airapetian N, Daurel C, Mira JP, Ramakers M, du Cheyron D, Le Coutour X, Daubin C, Charbonneau P; Members of the Cathedia Study Group. Femoral vs jugular venous catheterization and risk of nosocomial events in adults requiring acute renal replacement therapy: a randomized controlled trial. JAMA. 2008 May 28;299(20):2413-22. doi: 10.1001/jama.299.20.2413. PMID: 18505951.
- KDOQI; National Kidney Foundation. KDOQI Clinical Practice Guidelines and Clinical Practice Recommendations for Anemia in Chronic Kidney Disease. Am J Kidney Dis. 2006 May;47(5 Suppl 3):S11-145. doi: 10.1053/j.ajkd.2006.03.010. Erratum in: Am J Kidney Dis. 2006 Sep;48(3):518. PMID: 16678659.
- Merrer J, De Jonghe B, Golliot F, Lefrant JY, Raffy B, Barre E, Rigaud JP, Casciani D, Misset B, Bosquet C, Outin H, Brun-Buisson C, Nitenberg G; French Catheter Study Group in Intensive Care. Complications of femoral and subclavian venous catheterization in critically ill patients: a randomized controlled trial. JAMA. 2001 Aug 8;286(6):700-7. doi: 10.1001/jama.286.6.700. PMID: 11495620.
- Choi SR, Lee YK, Cho AJ, Park HC, Han CH, Choi MJ, Koo JR, Yoon JW, Noh JW. Malnutrition, inflammation, progression of vascular calcification and survival: Inter-relationships in hemodialysis patients. PLoS One. 2019 May 2;14(5):e0216415. doi: 10.1371/journal.pone.0216415. PMID: 31048884; PMCID: PMC6497382.
- Trottier SJ, Veremakis C, O'Brien J, Auer AI. Femoral deep vein thrombosis associated with central venous catheterization: results from a prospective, randomized trial. Crit Care Med. 1995 Jan;23(1):52-9. doi: 10.1097/00003246-199501000-00011. PMID: 8001386.