
More Information
Submitted: June 26, 2023 | Approved: March 01, 2024 | Published: March 04, 2024
How to cite this article: De Paola L, Panzino M, Saturno L, Mascaro MA, Vatrano M, et al. The Effect of Residence Time of No-tunneled Hemodialysis Catheters on Infection and Thrombosis Outcome. Identification of CVC’s Time Cut-off. J Clini Nephrol. 2024; 8: 023-031.
DOI: 10.29328/journal.jcn.1001122
Copyright License: © 2024 De Paola L, et al. This is an open access article distributed under the Creative Commons Attribution License, which permits unrestricted use, distribution, and reproduction in any medium, provided the original work is properly cited.
Keywords: No tunneled hemodialysis; Catheter (NTHC); Hemodialysis; Infection; Thrombosis

The Effect of Residence Time of No-tunneled Hemodialysis Catheters on Infection and Thrombosis Outcome. Identification of CVC’s Time Cut-off
Luciano De Paola1*, Mariantonia Panzino2, Laura Saturno1, Maria Antonietta Mascaro1, Marco Vatrano3, Federica De Paola4, Citraro Maria Lucia1, Bova Francesca1, D’Onofrio Giuseppina1 and Giovanni Ruotolo1
1Department of Medicine, Complex Operational Structure of Nephrology, AO Pugliese-Ciaccio, Via Pio X, 88100 Catanzaro, Italy
2Department of Medicine, Complex Operational Structure of Nephrology, Ospedale S Giovanni di Dio (Crotone), Via Bologna, 88900 Crotone, Italy
3Department of Cardiology, AO Pugliese-Ciaccio, Via Pio X, 88100 Catanzaro, Italy
4Medicine Department, University of Modena and Reggio Emilia (UNIMORE), Via Pietro Giardini, 1355, 41126 Baggiovara, Modena, Italy
*Address for Correspondence: Luciano De Paola, Department of Medicine, Complex Operational Structure of Nephrology, AO Pugliese-Ciaccio, Via Pio X, 88100 Catanzaro, Italy, Email: [email protected]
Introduction: Permanent vascular access (arteriovenous fistula (AVF), arteriovenous graft (AVG)) is susceptible to acute events that reduce patency. The temporary central venous catheter (CVC) constitutes bridging therapy for primary vascular access dysfunction. The impact of “residence time” on the rate of dysfunction/thrombosis or infection remains to be explored.
AIM: 1) To evaluate the impact of CVC residence time on outcomes (infection or Thrombosis/dysfunction) in consecutive temporary CVCs adjusted for the insertion site (upper site vs. lower site).
2) To establish a cut-off resident time.
Patients and methods: Seventeen prevalent hemodialysis patients with three consecutive CVCs are followed up prospectively in an observational study for a period equivalent to the permanence of the CVCs. The data is recorded at the beginning of the CVC time. The diagnosis of catheter-related bloodstream infection and thrombosis/dysfunction is made following the K-Doqi 2019 guidelines.
Statistical analysis: Seventeen hemodialysis patients (51 CVCs) were included. The ‘CVC resident time’ of each individual patient ((i.e. βcoefficient (log-transformed)*AUC)) was determined using LMM and then inserted into multivariate Cox models to assess infection and dysfunction/thrombosis outcomes (Joint Models). The AUC was calculated at various baseline levels of CVC time (10th……50th percentile). The cut-off point for thrombosis in CVC time corresponds to the mean of the CVC time at the 30th percentile of all CVCs.
Results: The CVC time is different for CVC’s site insertion and sequence. From the analysis of multivariate joint models, CVC resident time appears not to be significant for infection, but heterogenicity for the insertion site (ref3-4=upper site) is significant for the outcome of thrombosis/dysfunction. From the study of survival analysis, the free survival from outcomes by CVC site insertion appears to be significant for thrombosis/dysfunction. The average time of CVCs’ calculation at the 30th percentile is 14 days (cut-off).
Conclusion: No tunneled hemodialysis Catheter (NTHC) residence time is considered not to be a risk factor for infection, but it represents a risk factor for lower access thrombosis. After the cut-off time of 14 days, the advantage of the higher NTHCs is lost.
Many patients with end-stage kidney disease (ESKD) who start hemodialysis treatment lack permanent vascular access (late referral) [1]. In the context of prevalent hemodialysis patients (early referral), permanent vascular access (arteriovenous fistula (AVF), arteriovenous graft (AVG)) is susceptible to acute events that reduce patency. The good effectiveness of vascular access modifies the relationship between inflammation, malnutrition, oxidative stress, and cardiovascular outcome by increasing dialysis efficiency and allowing the achievement of KT/V values that improve survival [2]. The type and quality of vascular access predict outcomes in the hemodialysis setting [3]. Permanent vascular accesses are associated with better outcomes; conversely, central venous catheters (CVCs) are associated with increased mortality, regardless of comorbidity [4]. The K-DOKI 2019 guidelines indicate the priority of vascular accesses in line with the patient’s ESKD life plan [5]. KDOQI guidelines consider it reasonable to use tunneled CVC in preference to non-tunneled CVC due to the lower infection risk with tunneled CVC when the time expected for the use of vascular access or if a transplant option is plausible within a period > 3 months. KDOQI considers it reasonable to use non-tunneled internal jugular CVC only for temporary purposes for a limited time period (< 2 weeks or per individual facility policy) to limit infection risk and thrombosis /dysfunction. Nonetheless, the temporary CVC constitutes an important tool in the event of primary vascular access dysfunction (thrombosis, stenosis, infection, aneurysm, complications of venous puncture), constituting an important bridge therapy for the resolution of the event which should take place in a reasonable short time [6]. However, in the natural history of temporary CVCs, the impact of ‘residence time’ on the rate of dysfunction/thrombosis or infection is influenced by endogenous variables and exogenous variables (i.e., site insertion place), which make the residence time of temporary CVCs very flexible. The real-world evidence of residence time of temporary CVCs on infectious and dysfunction/thrombosis outcomes remains to be explored.
The goals of our study are:
1) To evaluate the impact of CVC residence time on the outcomes (infection or Thrombosis/dysfunction) in consecutive temporary CVCs adjusted for the insertion site: jugular (upper site) vs. femoral (lower site).
2) To establish a cut-off resident time beyond which the outcome is poor independently by CVC site placement.
Sample size
In a single dialysis center, seventeen prevalent hemodialysis patients out of 60 with three consecutive CVCs over 18 months (January 2021 – June 2022) are recruited consecutively and followed up prospectively in an observational study for a period equivalent to the permanence of the CVCs. Prevalent hemodialysis patients are defined as dialysis vintage > four months equipped with permanent vascular access for > 7 months. Patients were selected based on the number of consecutive CVCs (CVC sequence) in the range of the run-in period (3 CVCs); the rationale for inserting the temporary CVC is established by permanent vascular access dysfunction, which reduces its flow with a consequent decrease in dialysis efficiency. The insertion sites of the CVCs are determined by the characteristics of the venous vessels (dimension and flow of the common femoral and jugular), the number of previous CVCs in the same site, TWL entry, anthropometric characteristics (BMI), comorbidities (respiratory insufficiency, ascites, venous insufficiency). After carefully evaluating the previous variables, the venous sites available for inserting the CVCs are Type1: right femoral; type2: left femoral; type3: right jugular; type4: left jugular.
Patient characteristics
The demographic, biochemical, instrumental data and comorbidities are recorded at the beginning of the CVC time of each CVC and derived from the departmental database (Software GepaDial, Matera). The data relating to the individual dialysis sessions, the type of vascular access, and the actual medical therapy (anticoagulation and/or antiplatelet therapy) are recorded. Systolic blood pressure (SBP) and diastolic blood pressure (DBP) data are recorded at the start of the dialysis session for each temporary CVC (as the average of three consecutive hemodialysis sessions). BMI is calculated from dry weight as the average of three consecutive post-dialysis weights. The interdialytic period’s residual diuresis is collected to calculate the residual renal function (RRF). The biochemical, therapeutic, and instrumental data refer to the month of insertion of the temporary CVC. Serological evaluations of hemodialysis efficiency (urea, creatinine, glucose, CRP), blood counts (Hb, PLT, Hct, WBC), calcium-phosphorus metabolism (Ca, P, PTH), PT-INR, and PTT are examined. Withdrawals are processed at the central laboratory with standard methods. The comorbidity of Diabetes Mellitus is defined by the concomitance of therapy (oral and/or insulin) + 1 extrarenal complication; Heart failure (HF) is defined by FE < 40%; Atrial fibrillation (AF) is defined as arrhythmia > 3 months; coronary artery disease (CAD) is defined as present if coronary angiography is positive for coronary stenoses; vascular disease is defined as present if positive on CD or angiographic examination.
Definition of outcomes
Diagnosis of catheter-related bloodstream infection is based on clinical suspicion of infection (fever, rigors, altered mental status, or unexplained hypotension), blood cultures growing the same organism from the catheter hub and a peripheral vein (or the dialysis bloodline), and absence of evidence for an alternative source of infection. Catheter thrombosis/dysfunction is defined as the inability of a central venous catheter to (1) complete a single dialysis session without triggering recurrent pressure alarms or (2) reproducibly deliver a mean dialysis blood flow of > 300 ml/min (with arterial and venous pressures being within the hemodialysis unit parameters) on two consecutive dialysis sessions or provide a Kt/V≥ 1.2 in 4 hours or less (3) ultrasound control (K-Doqi guidelines 2019).
The study protocol was approved and in accordance with the institutional ethics committee of the Dulbecco Hospital, Catanzaro, Italy, and with the Helsinki Declaration of 1975 regarding the ethical principles for medical research involving human subjects. All patients had given oral consent for research use at the beginning of the run-in period.
Statistical analysis
Seventeen out of 60 hemodialysis patients who had three consecutive CVCs in an 18-month period were followed longitudinally for the time equivalent to CVC time (for a total of 51 CVCs). Data are presented as mean (standard deviation), median (interquartile range), and percentage (%), where required, and stratified by CVC sequence (first CVC, second CVC, third CVC). The difference in CVC time is analyzed for CVC sequence factor and CVC type factor (Type1: right femoral; type2 left femoral; type3 right jugular; type4 left jugular) by ANCOVA (Tukey – Kramer test).
Definition of the CVC resident time variable
The CVC times of the 3 CVCs of the single patient are considered as repeated measures to parameterize a measure of the residence time for every person and for each single temporary CVC (CVC residence time). In a linear mixed model (LMM), the extent of CVC time (outcome) is related to the series of patients (person variable) as a random effect to obtain a Beta coefficient for each person. An AUC curve of CVC times was constructed for each patient. The parameterization of each CVC time for each single individual sequence is given by: β coefficient (log-transformed) *AUC. The AUC component of the above formula is calculated at different baseline levels of CVC time (10th percentile, 20th percentile, 25th percentile, 30th percentile, 40th percentile, 50th percentile), resulting in different AUC (AUC 10°, AUC 20°, AUC 25°, AUC 30°, AUC 40°, AUC 50°). Finally, the CVC residence time for each sequence so obtained is entered as an exposure variable in a Cox model (Joint model analysis).
Sensitivity analysis and survival analysis
In the multivariate Cox model, the variables found significant in the univariate analysis (p < 0.25) are included and selected for the final model with the backward stepwise method to maximize R₂. The outcomes of the Joint Model are CVC infection and thrombosis/dysfunction (as defined in the methods paragraph). The CVC time cut-off for thrombosis is calculated and appears to correspond to the mean of the CVC time at the 30th percentile for all CVCs (n51). Patients enrolled in the study are censored at the event or the end of the observation period. No patients are lost to follow-up. In the survival analysis, the outcomes are correlated to the CVC residence time by Kaplan-Meyer analysis (Log-rank test) and stratified by place of insertion (upper vs. lower). P0.05 is significant. Statistical analysis is performed with NCSS 2020 software, Kaysville, UT, USA.
Seventeen prevalent hemodialysis patients out of 60 with three consecutive temporary CVCs (hereafter: CVCs) within the 18-month period were enrolled in the study. They are followed prospectively for a period corresponding to the permanence period of each single CVC (51 CVCs). The mean CVC time is 29.5 (20.5) days (Table 1).
| Table 1: Patient characteristic | |||||
| Variables | All(n 51) | CVC1(n17) | CVC2(n17) | CVC3(n17) | P * |
| Age | 69.8(14.6) | 69.2(14.8) | 69.5(14.7) | 70,8(15.2) | 0.94 |
| Sex(male) | 38(74.5) | 13(76.4) | 13(76.4) | 12(70.5) | 0.9 |
| BMI(weight/height₂) | 26.5(5.3) | 26.6(5) | 26.4(5.2) | 26.4(6.1) | 0.99 |
| SPB(mmHg) | 120.4(21) | 122.6(18.8) | 119.7(23.1) | 119.1(22) | 0.87 |
| DBP(mmHg) | 69.1(9.6) | 69.1(8.5) | 70.2(10.8) | 67.8(9.9) | 0.76 |
| Hb(gr/dl) | 9.5(1.6) | 9.7(2.1) | 9.2(1.3) | 9.4(1.4) | 0.76 |
| Ht(%) | 29.9(5) | 30.5(6.2) | 29.1(4.2) | 30(4.5) | 0.74 |
| WBC(x1000/mm₃) | 7.9(2.6) | 7.7(2.8) | 8.4(2.8) | 7.8(2.2) | 0.69 |
| Plt(x1000/mm₃) | 234(112) | 242(122) | 230(114) | 231(105) | 0.94 |
| Glucose(mg/dl) | 135(60) | 128(55) | 141(63) | 136(64) | 0.83 |
| Creatinin(mg/dl) | 8.1(3.8) | 9(4.06) | 7.8(3.6) | 7.4(2.9) | 0.46 |
| Urea(mg/dl) | 151(68) | 177(83) | 142(54) | 134(60) | 0.14 |
| RRF(ml/m') | 7(3.6) | 6.2(2.8) | 7.3(3.8) | 7.5(4.1) | 0.55 |
| Calcium(mg/dl) | 8.5(1.07) | 8.3(1.2) | 8.6(0.98) | 8.7(0.92) | 0.53 |
| Phosphate(mg/dl) | 4.69(1.97) | 5.43(2) | 4.1(2) | 4.4(1.6) | 0.17 |
| Anticoag/aggreg therapy(yes) | 24(47) | 8(47) | 8(47) | 8(47) | 1 |
| CVC permanent time(days) | 29.2(20) | 33.3(22) | 33.4(19) | 20.9(17) | 0.12 |
| Dialysis vintage(years) | 7(5-14) | 10(5.5-23) | 6.5(1.7-12.7) | 12(6-14) | 0.39 |
| Previous VA(ref BC ) | 34(66) | 7(41.1) | 14(82.3) | 13(76.4) | 0.02 |
| Diabetes(yes) | 20(39.2) | 7(41.1) | 6(35.29) | 7(41.1) | 0.92 |
| Hypertension(yes) | 45(88.2) | 15(88.2) | 15(88.2) | 15(88.2) | 1 |
| Polyarterial disease(yes) | 16(31.3) | 6(35.2) | 5(29.4) | 5(29.4) | 0.91 |
| HF(yes) | 12(23.5) | 4(23.5) | 5(29.4) | 3(17.6) | 0.71 |
| CAD(yes) | 13(25.4) | 4(23.5) | 5(29.5) | 4(23.5) | 0.9 |
| AF(yes) | 15(29.4) | 5(29.4) | 5(29.4) | 5(29.4) | 1 |
| Malingnacy(yes) | 12(23.5) | 4(23.5) | 4(23.5) | 4(23.5) | 1 |
| VApreviousTHrombosis(yes) | 10(19.6) | 1(5.8) | 4(23.3) | 5(29.4) | 0.15 |
| Infection(%) | 17(33) | 5(29.4) | 6(35.2) | 6(35.2) | 0.91 |
| Thrombosis(%) | 18(35.2) | 8(47) | 6(35.2) | 4(23.5) | 0.35 |
| CVC insertion site(Ref [3-4]) | 23(45.1) | 5(29.4) | 9(52.9) | 9(52.9) | 0.27 |
| CVC insertion site(Ref [3]) | 17(33.3) | 4(23.5) | 7(41.1) | 6(35.2) | 0.53 |
| CVC insertion site(Ref [1]) | 14(27.4) | 9(52.9) | 2(11.7) | 3(17.6) | 0.01 |
| CVC insertion site(Ref [1,2]) | 28(54.9) | 12(70.5) | 8(47) | 8(47) | 0.27 |
| *Fischer exact test, Kruskal-Wallis test, F-test, where required | |||||
The time of the first CVC and second CVC tends to be longer than the third CVC (mean difference 12.41 d (p = 0.07) and 12.47 d (p = 0.07)), respectively (Figure 1, Panel A). The CVC time is different for CVC’s site insertion. The time for right femoral CVC was longer than for left femoral CVC (mean difference 15.1 d, p = 0.05); the time of CVC in left femoral is shorter than for right jugular CVC (-15.37 d, p = 0.03) and left jugular CVC (-14.7 d, p = 0.13) (Figure 1, Panel B).
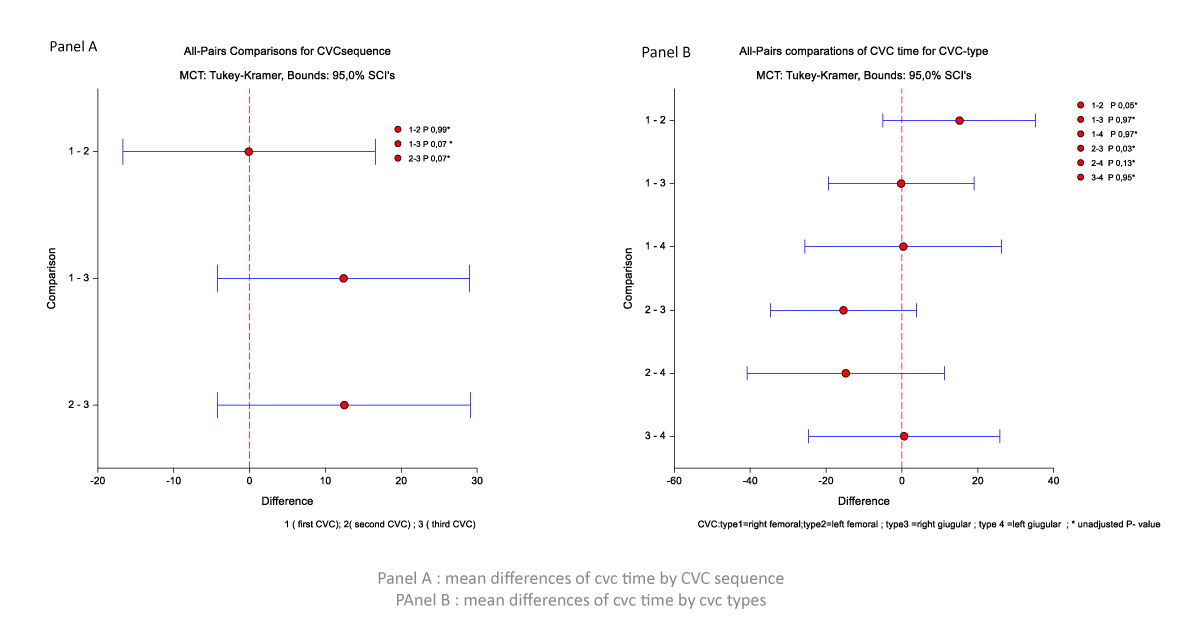
Figure 1: Mean differences of CVC time by CVC sequence and CVC types.
The incidence of CVC infection was 0.33 of total CVCs: first CVC 0.29, second CVC 0.35, third CVC 0.35 (p = 0.91). It tends to be lower in left femoral CVC than in other insertion sites: right femoral CVC 0.35, left femoral CVC 0.058, right jugular CVC 0.35, left jugular CVC 0.23 (p =0.03). The incidence of thrombosis/dysfunction was 0.35 in total CVCs: First CVC 0.44, Second CVC 0.33, third CVC 0.22 (p = 0.35). The incidence of thrombosis was lower in CVCs with upper insertion sites (right and left jugular CVCs) vs. CVCs with lower insertion sites (right and left femoral): right femoral CVC 0.27, left femoral CVC 0.55, right jugular CVC 0.16, left jugular CVC 0.0 (p = 0.001). No differences in biochemical, demographic variables, and comorbidities between patients were stratified by CVC sequence (Table 1). The proportion of patients with prior vascular access setup was higher at the second CVC (82.3%) and third CVC (76.4%) than at the first (p = 0.02). The percentage of femoral CVCs tended to be lower for the second and third CVCs than the first (right femoral CVC, p = 0.01), with complementary increases in upper CVCs, but not statistically significant (p = 0.27).
In Cox’s univariate analysis, the variables that tended to be significantly correlated with the infection outcome were: WBC 1.17(0.98-1.40) p = 0.07; creatinine 1.10(0.98-1.22) p = 0.07; Diabetes 0.33(0.10-1.06) p = 0.06 (Table 2).
| Table 2: Predictive factors of CVC infection by Cox univariate analysis. | |||
| Variables | β-coefficient( SD) | Hr (CI 95%) | p |
| Age | -0.009(0.01) | 0.99(0.96-1.02) | 0.55 |
| Sex(male) | 0.10(0.77) | 1.10(0.24-5.02) | 0.89 |
| BMI(weight/height₂) | 0.01(0.05) | 1.01(0.90-1.13) | 0.83 |
| SPB(mmHg) | -0.01(0.01) | 0.98(0.96-1.01) | 0.38 |
| DBP(mmHg) | -0.01(0.02) | 0.98(0.92-1.04) | 0.59 |
| Hb(gr/dl) | -0.05(0.15) | 0.94(0.69-1.29) | 0.74 |
| Ht(%) | -0.02(0.04) | 0.99(0.90-1.09) | 0.95 |
| WBC(x1000/mm₃) | 0.16(0.09) | 1.17(0.98-1.40) | 0.07 |
| Plt(x1000/mm₃) | -0.000039(0.002) | 1.000(0.99-1.00) | 0.98 |
| Glucose(mg/dl) | -0.007(0.005) | 0.99(0.98-1.003) | 0.15 |
| Creatinin(mg/dl) | 0.09(0.05) | 1.10(0.98-1.22) | 0.07 |
| Urea(mg/dl) | 0.002(0.005) | 1.00(0.99-1.01) | 0.63 |
| RRF(ml/m') | -0.10(-0.25) | 0.89(0.77-1.03) | 0.14 |
| Calcium(mg/dl) | 0.51(0.33) | 1.67(0.86-3.2) | 0.12 |
| Phosphate(mg/dl) | 0.13(0.20) | 1.15(0.76-1.72)) | 0.49 |
| Anticoag/aggreg therapy(yes) | -0.54(0.59) | 0.58(0.18-1.86) | 0.36 |
| Dialysis vintage(years) | 0.03(0.02) | 1.038(0.98-1.08) | 0.16 |
| Previous VA(ref BC ) | 0.96(0.76) | 2.61(0.58-11.17) | 0.20 |
| Diabetes(yes) | -1.09(0.59) | 0.33(0.10-1.06) | 0.06 |
| Hypertension(yes) | -0.22(0.77) | 0.80(0.17-3.66) | 0.77 |
| Polyarterial disease(yes) | -0.27(0.64) | 0.75(0.21-2.70) | 0.67 |
| HF(yes) | -0.64(0.65) | 0.52(0.14-1.91) | 0.32 |
| CAD(yes) | -1.25(1.03) | 0.29(0.03-2.26) | 0.24 |
| AF(yes) | -0.42(0.58) | 0.65(0.20-2.08) | 0.47 |
| Malingnacy( yes) | -0.38(0.58) | 0.67(0.21-2.15) | 0.51 |
| VApreviousTHrombosis(yes) | 0.26(0.66) | 1.3(0.35-4.7) | 0.68 |
| CVC insertion site(Ref [3,4]) | -0.13(0.52) | 0.87(0.31-2.4) | 0.80 |
| CVC insertion site(Ref [3]) | -0.41(0.54) | 0.65(0.22-1.89) | 0.43 |
| CVC insertion site(Ref [1]) | 0.24(0.53) | 1.27(0.45-3.6) | 0.64 |
| CVC insertion site(Ref [1,2]) | 0.13(0.52) | 1.14(0.40-3.19) | 0.80 |
| AUC30*logTimeBeta | -0.03(0.02) | 0.94(0.86-1.01) | 0.24 |
| B/C/HIV positivity | 0.65(0.55) | 1.92(0.65-5.6) | 0.23 |
Cox’s multivariate analysis, including variables with p < 0.25, resulted in the following variables as predictive factors of CVC infection: WBC risk ratio 1.37 (1.02-1.83) p = 0.04; RRF 0.75 (0.56-1,00) p = 0.05 (Table 3).
| Table 3: Predictive factors of CVC infection by Cox multivariate analysis. | |||
| Variables | Regression coeff | Hr (IC 95%) | p |
| WBC | 0.31 | 1.37 (1.02-1.83) | 0.04 |
| RRF | -0.28 | 0.7521 (0.56-1.00) | 0.05 |
| Glucose | -0.01 | 0.9817 (0.95 - 1.00) | 0.12 |
| AUC30*logTimebeta | -0.05 | 0.9441 (0.83-1.06) | 0.34 |
| ca | -0.43 | 0.65 (0.14-2.94) | 0.58 |
| previous VA(ref BC ) | 1.45 | 4.2819 (0.52-35.05) | 0.18 |
| B/C/HIVpositivity | 1.66 | 5.2978(0.08-312) | 0.42 |
| Diabetes | 2.27 | 9.7285(0.21 - 436) | 0.24 |
The interaction between the CVC type (ref. 3-4) and the CVC resident time (log CVC time beta coefficient *AUC) (AUC 10°, AUC 20°, AUC25°, AUC30°, AUC 40°, AUC 50°)) is not significant for the infection outcome (Table 4).
| Table 4: Relationship of the residence time variable with CVC infection by univariate and multivariate Cox analysis. | |||||
| Univariate analysis | Multivariate** interaction anlysis | ||||
| Variables: Resident time | Variables: Interactions | ||||
| (AUC* CVC time beta coeff) | HR(IC 95%) | p | resident time* CVCtype(ref3-4) | HR(IC 95%) | p |
| AUC 10° *CVC time beta coeff) | 0.97(0.91-1.03) | 0.36 | (AUC 10° *CVC time beta coeff) *CVCtype(ref3-4) | 1.12(0.85-1.47) | 0.38 |
| AUC 20° *CVC time beta coeff) | 0.99(0.998-1.0003) | 0.19 | (AUC 20° *CVC time beta coeff) *CVCtype(ref3-4) | 1.15(0.88-1.52) | 0.28 |
| AUC 25° *CVC time beta coeff) | 0.97(0.91-1.03) | 0.36 | (AUC 25° *CVC time beta coeff) *CVCtype(ref3-4) | 1.12(0.85-1.47) | 0.38 |
| AUC 30° *CVC time beta coeff) | 0.96(0.89-1.03) | 0.31 | (AUC 30° *CVC time beta coeff) *CVCtype(ref3-4) | 1.06(0.74-1.54) | 0.72 |
| AUC 40° *CVC time beta coeff) | 0.92(0.83-1.02) | 0.15 | (AUC 40° *CVC time beta coeff) *CVCtype(ref3-4) | 0.68(0.33-1.43) | 0.32 |
| AUC 50° *CVC time beta coeff) | 0.91(0.81-1.03) | 0.14 | (AUC 50°* CVC time beta coeff) *CVCtype(ref3-4) | 1.00(0.61-1.65) | 0.97 |
| **Adjusted for WBC , RRF | |||||
At the Cox univariate analysis, the risk predictors for thrombosis/dysfunction are Sex (male) Hr 0.37(0.14-0.96) p = 0.04; SBP Hr 1.03(1.00-1.05) p = 0.004; CVC insertion site(ref 3-4) Hr 0.17(0.05-0.61) p = 0.006; CVC insertion site (ref1-2)5.67(1.63-19) p = 0.006; AUC30*log time beta 0.92(0.85-0.98) p = 0.01 (Table 5).
| Table 5: Predictive factors of CVC Thrombosis/dysfunction by Cox univariate analysis. | |||
| Variables | β-coefficient( SD) | Hr (CI 95%) | p |
| Age | 0.03(0.002) | 1.03(0.09-1.08) | 0.07 |
| Sex(male) | -0.98(0.48) | 0.37(0.14-0.96) | 0.04 |
| BMI(weight/height₂) | 0.0180.04) | 1.01(0.92-1.11) | 0.80 |
| SPB(mmHg) | 0.03(0.01) | 1.03(1.00-1.05) | 0.004 |
| DBP(mmHg) | 0.03(0.02) | 1.04(0.99-1.09) | 0.10 |
| Hb(gr/dl) | -0.13(0.14) | 0.87(0.65-1.17) | 0.37 |
| Ht(%) | -0.05(0.04) | 0.94(0.85-1.03) | 0.24 |
| WBC(x1000/mm₃) | -0.01(0.08) | 0.99(0.84-1.18) | 0.98 |
| Plt(x1000/mm₃) | 0.001(0.002) | 1.00(0.99-1.00) | 0.39 |
| Glucose(mg/dl) | 0.002(0.003) | 1.00(0.99-1.00) | 0.55 |
| Creatinin(mg/dl) | -0.02(0.006) | 0.97(0.85-1.10) | 0.65 |
| Urea(mg/dl) | 0.0004(0.004) | 1.00(0.99-1.00) | 0.91 |
| RRF(ml/m') | -0.04(0.06) | 0.95(0.83-1.08) | 0.48 |
| Calcium(mg/dl) | -0.39(0.24) | 0.67(0.41-1.08) | 0.10 |
| Phosphate(mg/dl) | 0.03(0.14) | 1.03(0.77-1.38) | 0.83 |
| Anticoag/aggreg therapy(yes) | 0.22(0.47) | 1.25(0.49-3.16) | 0.63 |
| Dialysis vintage(years) | -0.02(0.03) | 0.97(0.91-1.03) | 0.44 |
| Previous VA(ref BC) | -0.02(0.03) | 0.92(0.34-2.469 | 0.87 |
| Diabetes(yes) | 0.16(0.47) | 1.17(0.46-2.98) | 0.72 |
| Hypertension(yes) | 0.19(0.75) | 1.20(0.27-5.3) | 0.80 |
| polyarterial disease(yes) | 0.06(0.53) | 1.06(0.37-3.02) | 0.90 |
| HF(yes) | -0.64(0.63) | 0.52(0.14-1.83) | 0.31 |
| CAD(yes) | 0.39(0.53) | 1.48(0.52-4.19) | 0.45 |
| AF(yes) | -0.52(0.56) | 0.58(0.19-1.8) | 0.35 |
| Malingnacy(yes) | -0.43(0.57) | 0.64(0.21-1.09) | 0.45 |
| VApreviousTHrombosis(yes) | 0.47(0.52) | 1.61(0.57-4.5) | 0.36 |
| CVC insertion site(Ref [3,4]) | -1.73(0.63) | 0.17(0.05-0.61) | 0.006 |
| CVC insertion site(Ref [3]) | -1.13(0.63) | 0.32(0.09-1.10) | 0.07 |
| CVC insertion site(Ref [1]) | -0.11(0.52) | 0.88(0.31-2.51) | 0.82 |
| CVC insertion site(Ref [1,2]) | 1.73(0.63) | 5.67(1.63-19) | 0.006 |
| AUC30*logTimeBeta | -0.08(0.03) | 0.92(0.85-0.98) | 0.01 |
| B/C/HIV positivity | -0.82(0.53) | 0.43(0.15-1.24) | 0.12 |
In Cox’s multivariate analysis, the following variables resulted as predictors of thrombosis/dysfunction (Table 6):
| Table 6: Predictive factors of CVC thrombosis/dysfunction by Cox multivariate analysis. | |||
| Variables | Regression coeff | Hr(IC 95%) | p |
| Age | 0.064 | 1.0664(1.00-1.13) | 0.0371 |
| Ca | -0.804 | 0.4475(0.25-0.77) | 0.004 |
| auc30*logtimebeta | -0.037 | 0.9639(0.88-1.05) | 0.4071 |
| (CVCREF34 = 1) | 2.520 | 0.0805(0.01-0.42) | 0.0028 |
Age 1.06 (1.00-1.13) p = 0.03; Calcium 0.44(0.25-0.77) p = 0.004; CVC site insertion (ref 3-4) 0.08 (0.01-0.42) p = 0.002. The interaction between CVC resident time and CVC site insertion (Ref 3-4) is a predictive factor of thrombosis/dysfunction for AUC10° up to AUC 30°. It is not for AUC 40° and AUC 50°. (Table 7) (Figure 2).
| Table 7: Relationship of the residence time variable with CVC thrombosis/dysfunction by univariate and multivariate Cox analysis. | |||||
| Univariate analysis | Multivariate** interaction anlysis | ||||
| Variables: Resident time | Variables: Interactions | ||||
| (AUC* CVC time beta coeff) | HR(IC 95%) | p | resident time* CVCtype(ref3-4) | HR(IC 95%) | p |
| AUC 10° *CVC time beta coeff) | 0.91(0.85-0.97) | 0,005 | (AUC 10° *CVC time beta coeff) *CVCtype(ref3-4) | 0.70(0.53-0.93) | 0.01 |
| AUC 20° *CVC time beta coeff) | 0.91(0.85-0.96) | 0.003 | (AUC 20° *CVC time beta coeff) *CVCtype(ref3-4) | 0.73(0.56-0.97) | 0.03 |
| AUC 25° *CVC time beta coeff) | 0.91(0.85-0.97) | 0,005 | (AUC 25° *CVC time beta coeff) *CVCtype(ref3-4) | 0.71(0.53-0.94) | 0.01 |
| AUC 30° *CVC time beta coeff) | 0.92(0.85-0.98) | 0.001 | (AUC 30° *CVC time beta coeff) *CVCtype(ref3-4) | 0.68(0.48-0.97) | 0.03 |
| AUC 40° *CVC time beta coeff) | 0.96(0.88-1.04) | 0.35 | (AUC 40° *CVC time beta coeff) *CVCtype(ref3-4) | 0.66(0.37-1.18) | 0.16 |
| AUC 50° *CVC time beta coeff) | 1.01(0.94-1.09) | 0.65 | (AUC 50° *CVC time beta coeff) *CVCtype(ref3-4) | 0.71(0.37-1.34) | 0.28 |
| **Adjusted for age , Calcium | |||||
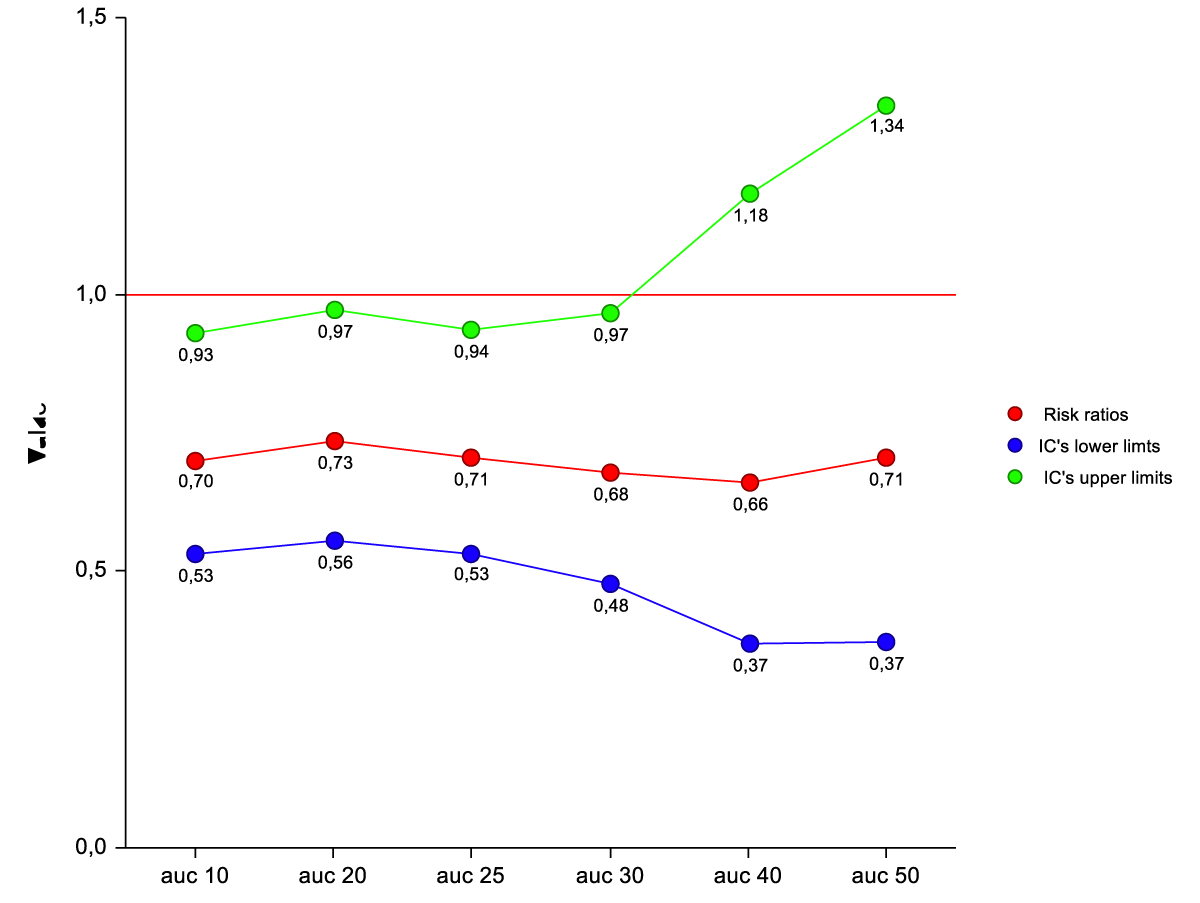
Figure 2: Risk ratios of thrombosis/dysfunction by Cox analysis for interactions between AUC*beta coefficient (CVC resident time) and CVC type (ref3-4) at different levels of AUC (percentiles).
The average time CVCs calculation at the 30th percentile is 14 days.
By Kaplan-Meier analysis, thrombosis/temporary CVC dysfunction was independently and indirectly related to CVC site insertion (ref3-4) (Figure 3). The rate of thrombosis/dysfunction is 3(16,6%) vs. 15 (83,3) in upper CVC vs. lower CVC respectively (HR 0,06 (0,01-0,30). This relationship is significant for time on the abscissa (CVC time beta coefficient *AUC) from AUC10° to AUC 30°. For AUC 40° and AUC 50°, the advantage of upper CVCs compared to the outcome (thrombosis/dysfunction) is lost (Figure 2). By Kaplan-Meier analysis, infection outcome was not significantly related to CVC site insertion (ref 3-4) over the same time range (CVC time beta coefficient *AUC 10° through AUC 30°) (Figure 4).
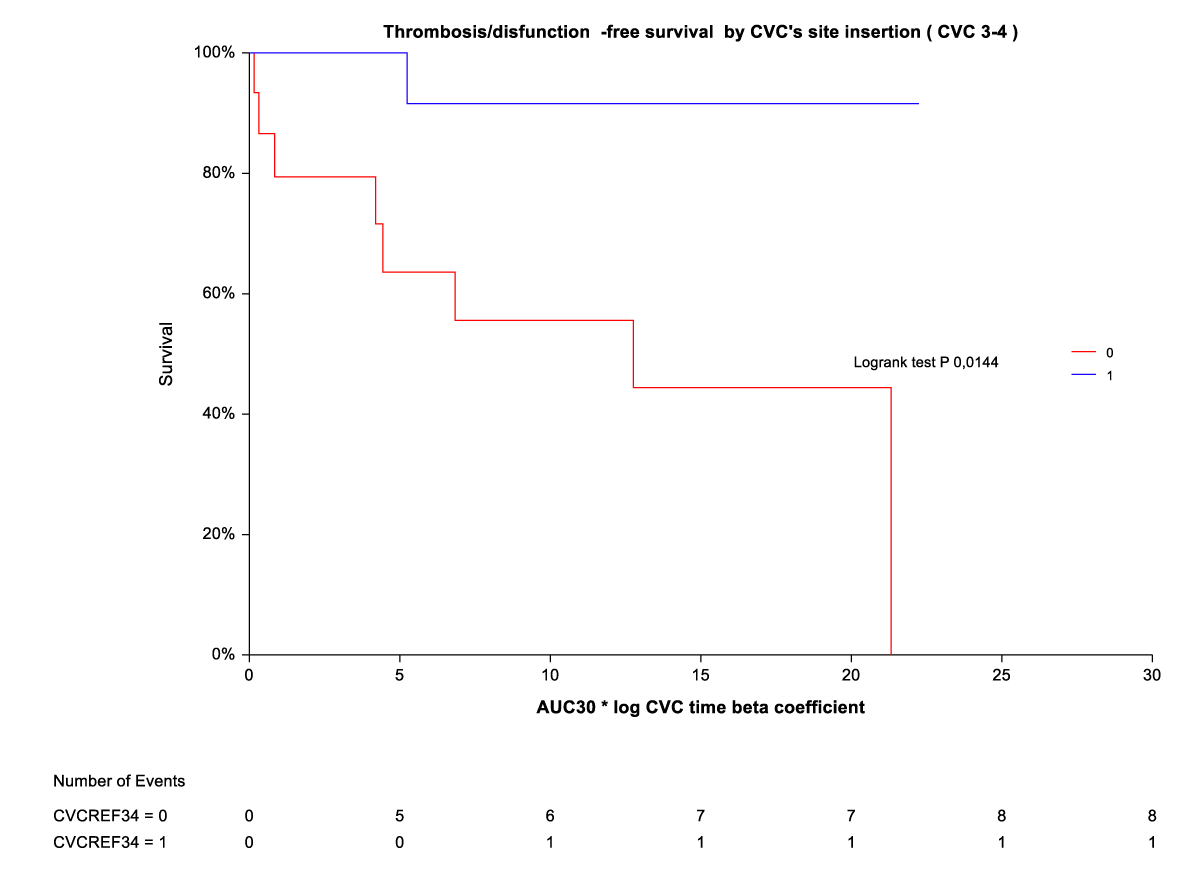
Figure 3: Thrombosis/dysfunction-free survival by CVC site insertion [3,4).
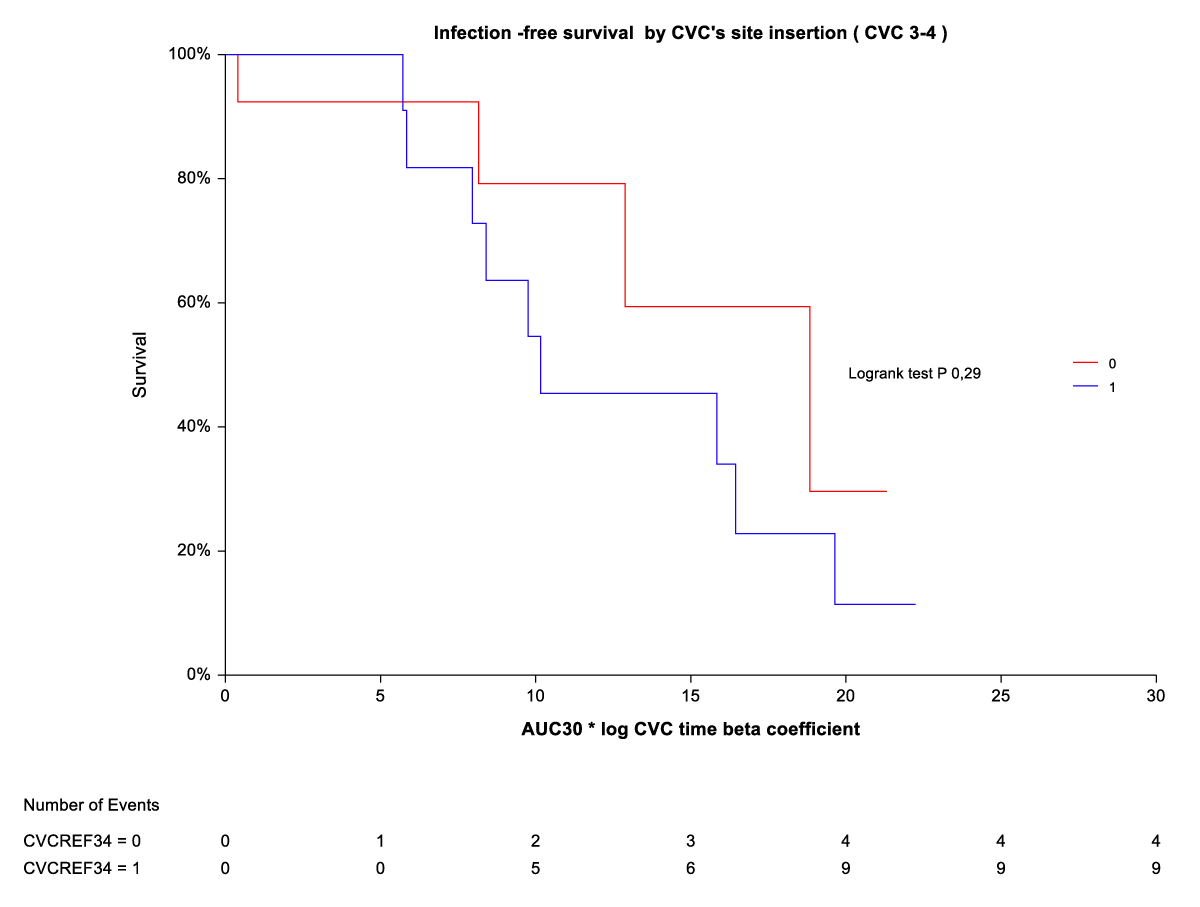
Figure 4: Infection-free survival by CVC site insertion [3,4].
From our study, the CVC time appears to be different for CVC’s site insertion and sequence (Figure 1). From the analysis of multivariate joint models, CVC resident time appears not to be significant for infection, but heterogenicity for the insertion site (ref3-4=upper site) is significant for the outcome of thrombosis/dysfunction (Table 7). From the study of survival analysis, the free survival from outcome by CVC site insertion appears to be significant for thrombosis/dysfunction. The average time of CVCs’ calculation at the 30th percentile is 14 days(cut-off).
In hemodialysis patients, the temporary CVC is a useful tool [7-9]. In late referral and/or AKI patients, immediate vascular access allows the start of hemodialysis treatment with immediate restoration of acid-base and electrolyte, metabolic, and volume balance. In most patients on hemodialysis (early referral), temporary CVC is often warranted as bridge therapy due to acute or subacute permanent vascular access (AVF, AV GRAFT) events: thrombosis/dysfunction, infection, decreased patency, aneurysmal dilatation, stenosis, venipuncture complications, until resolution of the primary vascular access event. The K-DOQI 2019 guidelines indicate the priority of vascular accesses in line with the patient’s ESKD life plan [10]. Permanent vascular access (AVF, AV graft) correlates with longer survival in hemodialysis patients (35% reduction in mortality rate in the AVF; 18% reduction in mortality rate in the AVG) vs. tunneled CVC and CVC temporary [11]. Nonetheless, temporary CVCs (NTHC) are burdened by a high incidence of a catheter-related infection (CRI) and a CVC lumen thrombosis (intrinsic thrombosis within the catheter lumen or formation of a fibrin sheath or extrinsic thrombosis encasing the catheter) [7]. These outcomes may be related to the site of CVC insertion. In the Cathedia study [12], Duguè, et al. analyzed 134 patients who underwent two different catheterization sites, 57 and 77 of whom were initially randomized in the femoral and jugular sites, respectively. Time to catheter-tip colonization at removal was not significantly different between the two sites of insertion (median, 14 days in both groups; hazard ratio 0.99; 95% confidence interval, 0.61-1.59; p = 0.96), as well as time to dysfunction (HR 1.20 (0.74-1.95)). Kidney Disease Outcomes Quality Initiative guidelines (2006 update) for vascular access suggest that NTHCs should not be used for more than one week at the internal jugular vein (IJ) or subclavian vein (SC) sites and a maximum of 5 days at the femoral site [13]. This recommendation was based on a study by Weijmer MC, et al. showed significantly higher infection rates for patients initiating hemodialysis with NTHCs compared with tunneled HD catheters and an exponential increase in the risk of infection after one week for NTHCs [14]. Centers for Disease Control and Prevention guidelines 2013 suggest that tunneled catheters be considered if dialysis access is expected to be required for more than three weeks [15]. KDOQI (2019) considers it reasonable in valid clinical circumstances to use tunneled CVCs for short-term or long-term durations for incident patients, as follows (Expert Opinion). For Short-term duration, which is the object of our discussion, the indications are: 1) AVF or AVG created but not ready for use and dialysis is required, 2)acute transplant rejection or other complications requiring dialysis, 3)PD patient with complications that require time-limited peritoneal rest or resolution of complication (e.g., pleural leak), 4) patient has a living donor transplant confirmed with an operation date shortly (e.g., < 90 days) but requires dialysis, 5) AVF or AVG complication such as major infiltration injury or cellulitis that results in temporary nonuse until the problem is resolved. This is to limit infection risk and thrombosis /dysfunction without high-level evidence. An RCT of Klouche, et al. that included 34 patients with AKI who required incident dialysis randomized them to receive femoral NTHCs versus tunneled femoral HD catheters [7]. This study found fewer infections and better catheter function but more hematomas and longer insertion times for those assigned to receive a tunneled catheter. Weijmer and Klouce’s studies [6,7] focus on optimal timing for replacing NTHC or for switching from an NTHC to a tunneled HD catheter when the need for dialysis continues over time. The difficulty in establishing the timing is determined by the lack of a CVC permanence time cut-off that identifies a significant likelihood of infection and thrombosis/dysfunction in prospective studies. Our work examined two outcomes: infection and Thrombosis/dysfunction. We found no differences in the incidence rate of infection between Upper CVC and lower CVC. Our results are like the CATHEDIA study [12]. We found a higher incidence of thrombosis/dysfunction in lower NTHC than in upper NTHC. The following studies came to the same result. Trottier, et al. found a higher incidence of thrombosis in NTHC femoral vs. jugular and subclavian (25% for femoral vs. 0% for jugular and subclavian sites) [16]. Merrer, et al. found a higher incidence of thrombosis/dysfunction in lower NTHC (21% for femoral vs. 2% for the subclavian site) [14].
The limitations of our study are determined by sample size, bias by indication, and unconsidered confounding variables. Possible selection bias and sample size did not allow controlling for BMI heterogeneity, a relationship that is instead consolidated in Parienti’s study and CATHEDIA STUDY. Parienti JJ, et al. demonstrated that the risk of CLABSI may be lower in patients with femoral NTHCs if BMI is < 24.2 and for IJ NTHCs if the BMI > 28.4 according to a pre-specified analysis from the Cathedia Study based on the lowest and highest BMI tertiles of included patients [9]. Our study has the advantage of having selected patients with three consecutive NTHCs. The use of the marginal model made it possible to reduce the variance of NTHC time in the CVC sequence and the identification of a Beta coefficient for each patient, which was introduced together with the AUC of the CVC time in a variable that summarizes a cumulative CVC time in the single individual (residence time NTHC). Using the AUC time of NTHC at different baseline time percentiles has allowed the identification of an NTHC time cut-off which is informed by the recommendation of the DOQI 2019 guidelines [10].
In conclusion, our study demonstrated that the NTHC residence time is considered not to be a risk factor for infection, but it represents a risk factor for lower access thrombosis. This relationship is time-limited. The identification of a cut-off time of 14 days has shown that, after this time, the advantage of the higher NTHCs is lost. The extent of this cut-off complies with the recommendations of the 2019 K-DOKI guidelines.
Declaration
All authors confirm that the manuscript has not been previously submitted to the Journal of Clinical Nephrology Publication for review and that the manuscript is not under review for publication elsewhere and will not be submitted to another publication entity during the review period at the Journal of Clinical Nephrology Publication.
- Malas MB, Canner JK, Hicks CW, Arhuidese IJ, Zarkowsky DS, Qazi U, Schneider EB, Black JH 3rd, Segev DL, Freischlag JA. Trends in incident hemodialysis access and mortality. JAMA Surg. 2015 May;150(5):441-8. doi: 10.1001/jamasurg.2014.3484. PMID: 25738981.
- Ko GJ, Rhee CM, Obi Y, Chang TI, Soohoo M, Kim TW, Kovesdy CP, Streja E, Kalantar-Zadeh K. Vascular access placement and mortality in elderly incident hemodialysis patients. Nephrol Dial Transplant. 2020 Mar 1;35(3):503-511. doi: 10.1093/ndt/gfy254. PMID: 30107612; PMCID: PMC7057539.
- Napalkov P, Felici DM, Chu LK, Jacobs JR, Begelman SM. Incidence of catheter-related complications in patients with central venous or hemodialysis catheters: a health care claims database analysis. BMC Cardiovasc Disord. 2013 Oct 16;13:86. doi: 10.1186/1471-2261-13-86. PMID: 24131509; PMCID: PMC4015481.
- Dugué AE, Levesque SP, Fischer MO, Souweine B, Mira JP, Megarbane B, Daubin C, du Cheyron D, Parienti JJ; Cathedia Study Group. Vascular access sites for acute renal replacement in intensive care units. Clin J Am Soc Nephrol. 2012 Jan;7(1):70-7. doi: 10.2215/CJN.06570711. Epub 2011 Nov 10. PMID: 22076877; PMCID: PMC3265351.
- O'Grady NP, Alexander M, Burns LA, Dellinger EP, Garland J, Heard SO, Lipsett PA, Masur H, Mermel LA, Pearson ML, Raad II, Randolph AG, Rupp ME, Saint S; Healthcare Infection Control Practices Advisory Committee (HICPAC). Guidelines for the prevention of intravascular catheter-related infections. Clin Infect Dis. 2011 May;52(9):e162-93. doi: 10.1093/cid/cir257. Epub 2011 Apr 1. PMID: 21460264; PMCID: PMC3106269.
- Weijmer MC, Vervloet MG, ter Wee PM. Compared to tunnelled cuffed haemodialysis catheters, temporary untunnelled catheters are associated with more complications already within 2 weeks of use. Nephrol Dial Transplant. 2004 Mar;19(3):670-7. doi: 10.1093/ndt/gfg581. PMID: 14767025.
- Klouche K, Amigues L, Deleuze S, Beraud JJ, Canaud B. Complications, effects on dialysis dose, and survival of tunneled femoral dialysis catheters in acute renal failure. Am J Kidney Dis. 2007 Jan;49(1):99-108. doi: 10.1053/j.ajkd.2006.09.014. PMID: 17185150.
- Lawson JH, Niklason LE, Roy-Chaudhury P. Challenges and novel therapies for vascular access in haemodialysis. Nat Rev Nephrol. 2020 Oct;16(10):586-602. doi: 10.1038/s41581-020-0333-2. Epub 2020 Aug 24. PMID: 32839580; PMCID: PMC8108319.
- Clark EG, Barsuk JH. Temporary hemodialysis catheters: recent advances. Kidney Int. 2014 Nov;86(5):888-95. doi: 10.1038/ki.2014.162. Epub 2014 May 7. PMID: 24805107; PMCID: PMC4220490.
- Lok CE, Huber TS, Lee T, Shenoy S, Yevzlin AS, Abreo K, Allon M, Asif A, Astor BC, Glickman MH, Graham J, Moist LM, Rajan DK, Roberts C, Vachharajani TJ, Valentini RP; National Kidney Foundation. KDOQI Clinical Practice Guideline for Vascular Access: 2019 Update. Am J Kidney Dis. 2020 Apr;75(4 Suppl 2):S1-S164. doi: 10.1053/j.ajkd.2019.12.001. Epub 2020 Mar 12. Erratum in: Am J Kidney Dis. 2021 Apr;77(4):551. PMID: 32778223.
- Al-Jaishi AA, Lok CE, Garg AX, Zhang JC, Moist LM. Vascular access creation before hemodialysis initiation and use: a population-based cohort study. Clin J Am Soc Nephrol. 2015 Mar 6;10(3):418-27. doi: 10.2215/CJN.06220614. Epub 2015 Jan 7. PMID: 25568219; PMCID: PMC4348683.
- Parienti JJ, Thirion M, Mégarbane B, Souweine B, Ouchikhe A, Polito A, Forel JM, Marqué S, Misset B, Airapetian N, Daurel C, Mira JP, Ramakers M, du Cheyron D, Le Coutour X, Daubin C, Charbonneau P; Members of the Cathedia Study Group. Femoral vs jugular venous catheterization and risk of nosocomial events in adults requiring acute renal replacement therapy: a randomized controlled trial. JAMA. 2008 May 28;299(20):2413-22. doi: 10.1001/jama.299.20.2413. PMID: 18505951.
- KDOQI; National Kidney Foundation. KDOQI Clinical Practice Guidelines and Clinical Practice Recommendations for Anemia in Chronic Kidney Disease. Am J Kidney Dis. 2006 May;47(5 Suppl 3):S11-145. doi: 10.1053/j.ajkd.2006.03.010. Erratum in: Am J Kidney Dis. 2006 Sep;48(3):518. PMID: 16678659.
- Merrer J, De Jonghe B, Golliot F, Lefrant JY, Raffy B, Barre E, Rigaud JP, Casciani D, Misset B, Bosquet C, Outin H, Brun-Buisson C, Nitenberg G; French Catheter Study Group in Intensive Care. Complications of femoral and subclavian venous catheterization in critically ill patients: a randomized controlled trial. JAMA. 2001 Aug 8;286(6):700-7. doi: 10.1001/jama.286.6.700. PMID: 11495620.
- Choi SR, Lee YK, Cho AJ, Park HC, Han CH, Choi MJ, Koo JR, Yoon JW, Noh JW. Malnutrition, inflammation, progression of vascular calcification and survival: Inter-relationships in hemodialysis patients. PLoS One. 2019 May 2;14(5):e0216415. doi: 10.1371/journal.pone.0216415. PMID: 31048884; PMCID: PMC6497382.
- Trottier SJ, Veremakis C, O'Brien J, Auer AI. Femoral deep vein thrombosis associated with central venous catheterization: results from a prospective, randomized trial. Crit Care Med. 1995 Jan;23(1):52-9. doi: 10.1097/00003246-199501000-00011. PMID: 8001386.