
More Information
Submitted: September 26, 2023 | Approved: October 12, 2023 | Published: October 13, 2023
How to cite this article: Tanaka K, Higashimoto Y, Tomizawa M, Motomiy Y, Kaneko Y. Circulating Levels of Fibroblast Growth Factor 23 Selective for C-Terminal (FGF23-CT) in Hemodialysis Patients. J Clini Nephrol. 2023; 7: 085-091.
DOI: 10.29328/journal.jcn.1001115
Copyright License: © 2023 Tanaka K, et al. This is an open access article distributed under the Creative Commons Attribution License, which permits unrestricted use, distribution, and reproduction in any medium, provided the original work is properly cited.
Keywords: FGF23; C-Terminal Fragment; Hemodialysis; Serology
Nonstandard Abbreviations: FGF23: Fibroblast Growth Factor 23; Pi: Inorganic Phosphate; CKD: Chronic Kidney Disease; HD: Hemodialysis; FGF23-CT: C-Terminal Fragment Of FGF23; iFGF23: Intact FGF23; tFGF23: Total FGF23; i/t FGF23 Ratio: iFGF23/Tfgf23 Ratio; cCa: Corrected Calcium; ESA: Erythropoiesis-Stimulating Agent; PPCs: Proprotein Convertases; HIF: Hypoxia Inducible Factor; CPP: Calciprotein Particle

Circulating Levels of Fibroblast Growth Factor 23 Selective for C-Terminal (FGF23-CT) in Hemodialysis Patients
Kenji Tanaka1*, Yuichiro Higashimoto2, Mituru Tomizawa3, Yasuki Motomiy1 and Yoshiteru Kaneko1
1Suiyukai Clinic, Kashihara, Nara 634-0007, Japan
2Department of Chemistry, Kurume University School of Medicine, Fukuoka, Japan
3Department of Urology, Nara Medical University, Nara, Japan
*Address for Correspondence: Kenji Tanaka, Suiyukai Clinic, Kashihara, Nara 634-0007, Japan, Email: [email protected]; [email protected]
Background: In hemodialysis patients, fibroblast growth factor 23 (FGF23) has reportedly been associated with the development of cardiovascular complications and a high risk of mortality. Our objective here was to study the cleavage characteristics of FGF23 in hemodialysis patients.
Methods: This study design is a cross-sectional observational investigation of three facilities without intervention. To assess FGF23 concentrations, we obtained plasma samples from 97 hemodialysis patients before the hemodialysis session and from 16 healthy volunteers. We measured the FGF23 C-terminal fragment and intact FGF23 concentrations by using a commercial enzyme-linked immunosorbent assay.
Results: Serum levels of the FGF23 C-terminal fragment were 189 ± 121 ng/mL in healthy volunteers and 306 ± 206 ng/mL in hemodialysis patients. The ratios of intact FGF23 to total FGF23 were 0.03 ± 0.03 in healthy volunteers and 0.44 ± 0.28 in hemodialysis patients. The ratios were positively correlated with levels of inorganic phosphate in hemodialysis patients (p < 0.001, r < 0.52).
Conclusion: We measured actual levels of the serum FGF23 C-terminal fragment in hemodialysis patients by using a new commercial kit for the first time. The ratio of intact FGF23 to total FGF23 was lower in healthy controls than the ratio in hemodialysis patients. The cleavage percentage of FGF23 was considerably higher in both groups of subjects than previously thought. We suggest that hyperphosphatemia in hemodialysis patients was associated with impaired cleavage of FGF23.
Fibroblast growth factor 23 (FGF23), as well as parathyroid hormone, is an indispensable regulator of inorganic phosphate (Pi) in the body. Serum levels of FGF23 reportedly increased progressively along with the stage of Chronic Kidney Disease (CKD) and were associated with the development of cardiovascular complications and a high risk of mortality in Hemodialysis (HD) patients [1-3].
FGF23 is produced mainly in bone tissue and is cleaved intracellularly into two inactive fragments, i.e., the N-terminal fragment, and the C-terminal fragment of FGF23 (FGF23-CT). Therefore, three molecular forms—the intact full-length FGF23 (iFGF23), the N-terminal fragment, and the FGF23-CT—can be found in circulation because the cleavage site is believed to be limited to the Arg176XXArg179 motif, which indicates that the cleavage percentage of FGF23 may be deduced from the molecular number of iFGF23 or FGF23-CT per total numbers of both iFGF23 and FGF23-CT (total FGF23: tFGF23), i.e., from the iFGF23 to tFGF23 ratio (i/t FGF23 ratio) or the FGF23-CT to tFGF23 ratio.
However, to our knowledge, the cleavage characteristics of this important molecule have not yet been published because of the lack of a direct assay system to measure FGF23-CT exclusively. Recent clinical studies including our previous one have shown that serum concentrations of Pi may be the most powerful contributor to boost serum FGF23 levels in HD patients and that the cleavage process may be considerably suppressed in HD patients [4,5]. Here in our report, we provide the actual serum FGF23-CT levels and the i/t FGF23 ratio in HD patients and discuss the significance of serum Pi concentrations for the cleavage ratio as well as for FGF23 production.
Study design
This design is a cross-sectional observational investigation of three facilities without intervention.
Subjects
Ninety-six patients, 52 male, and 45 female, who had undergone regular HD for more than 4 months (median 73 months), were included in this study; 16 healthy volunteers, 8 male and 8 female, ages 49.7 ± 8.3 years (mean ± Standard Deviation [SD]), served as controls. The mean ± SD age of the patients was 72.9 ± 10.6 years. The primary diseases of the patients’ CKD were nondiabetic (30 patients), diabetic nephropathy (36 patients), and unknown (31 patients). The mean ± SD of the single-pool KT/Vurea, which is an index of HD dose calculated by urea kinetics [6], was 1.32 ± 0.27 (Supplemental Table 1).
| Supplemental Table 1: Demographics of the patients. | |
| Parameters | Values for HD patients (n = 97) as means ± SD or n/N (%) |
| Age (years) | 72.9 ± 10.6, median 73 (68,81) |
| Female | 45/97 (46.4) |
| Body mass index | 22.2 ± 4.1 |
| Duration of dialysis (months) | 119.8 ± 107.1, median 93 (34,183.5) |
| Etiology CGN: T2DM: unknown | 30 (31):36 (37):31 (32) |
| Hemodiafiltration | 31/97 (32.0) |
| Use of polysulfone membrane | 54/97 (55.7) |
| Single-pool KT/Vurea | 1.32 ± 0.27 |
| Treatment with ESAs | 82/97 (84.5) |
| Parenteral ferrotherapy | 49/97 (50.5) |
| Abbreviations: HD: Hemodialysis; CGN: Chronic Glomerulonephritis; T2DM: Type 2 Diabetes Mellitus; ESA: Erythropoiesis-Stimulating Agent. | |
The following cases were excluded: Patients under the age of 20, cases for which written consent cannot be obtained, patients with cancer, obvious bleeding disorders such as gastrointestinal bleeding, chronic inflammatory diseases, a prognosis considered to be within one year, cases with serious diseases that currently require treatment.
Erythropoieses-stimulating agents (ESAs) and iron repletion
To treat renal anemia, three ESAs, including epoetin beta, darbepoetin alfa, or epoetin beta pegol, were administered. The ESA dosage conversion ratio that we used was epoetin β (unit/week): darbepoetin alfa (g/week): epoetin beta pegol (g/week) = 1:200:240, as in our previous studies. We achieved iron repletion by using intravenous saccharated ferric oxide. Both treatments were administered at the end of the HD session.
Measurements
Basic laboratory variables for the HD patients were measured at FALCO Biosystems, Ltd (Kyoto, Japan). We measured the serum levels of iFGF23 and FGF23-CT by using the Human FGF23 (Intact) ELISA (enzyme-linked immunosorbent assay) Kit (Immutopics, Inc., San Clemente, CA, USA), and High Sensitivity Human Fibroblast Growth Factor 23 C Terminal Peptide (FGF-23 CT) ELISA Kit (Aviscera Bioscience, Inc., Santa Clara, CA, USA), respectively. Every measurement was done in duplicate. Recombinant iFGF23 was purchased from Prospec (Rehovot, Israel).
Full-length FGF23 (aa25-aa251) undergoes cleavage at one site, i.e., between arginine 179 and serine180, so the value of the total moles of iFGF23 and FGF23-CT was expressed as tFGF23 pmol/L in this study, on the basis of a previous report by Bhattacharyya et al., although their tFGF23 unit was RU/mL [7].
Statistical analysis
All data are expressed as means ± SD or n (%). Statistical comparisons were performed by using the two-tailed Student t-test for normally distributed variables and the Wilcoxon rank sum test for non-normally distributed variables. The Pearson correlation coefficient was used as a measure of the linear correlation between two sets of data. For non-normally distributed variables, the correlation coefficient was obtained by using the natural logarithm of these variables. All analyses were performed with JMP version 9.0.0 (University of California, Merced, CA, USA). The level of statistical significance was set at p < 0.05. p values are two-sided.
Verification of the absorption capacity of the affinity column for iFGF23
Before measuring the serum FGF23-CT levels with the ELISA kit, we used recombinant iFGF23 without glycosylation to determine the absorption capacity of the column for iFGF23. The optical density for the lowest detection limit of our absorptiometer was 0.03. As Figure 1 shows, therefore, we could not detect a measurable value of iFGF23 even at the high concentration of 15.6 ng/mL. However, with FGF23-CT, we confirmed a good dose-dependent reference line up to 8 ng/mL (Figure 1).
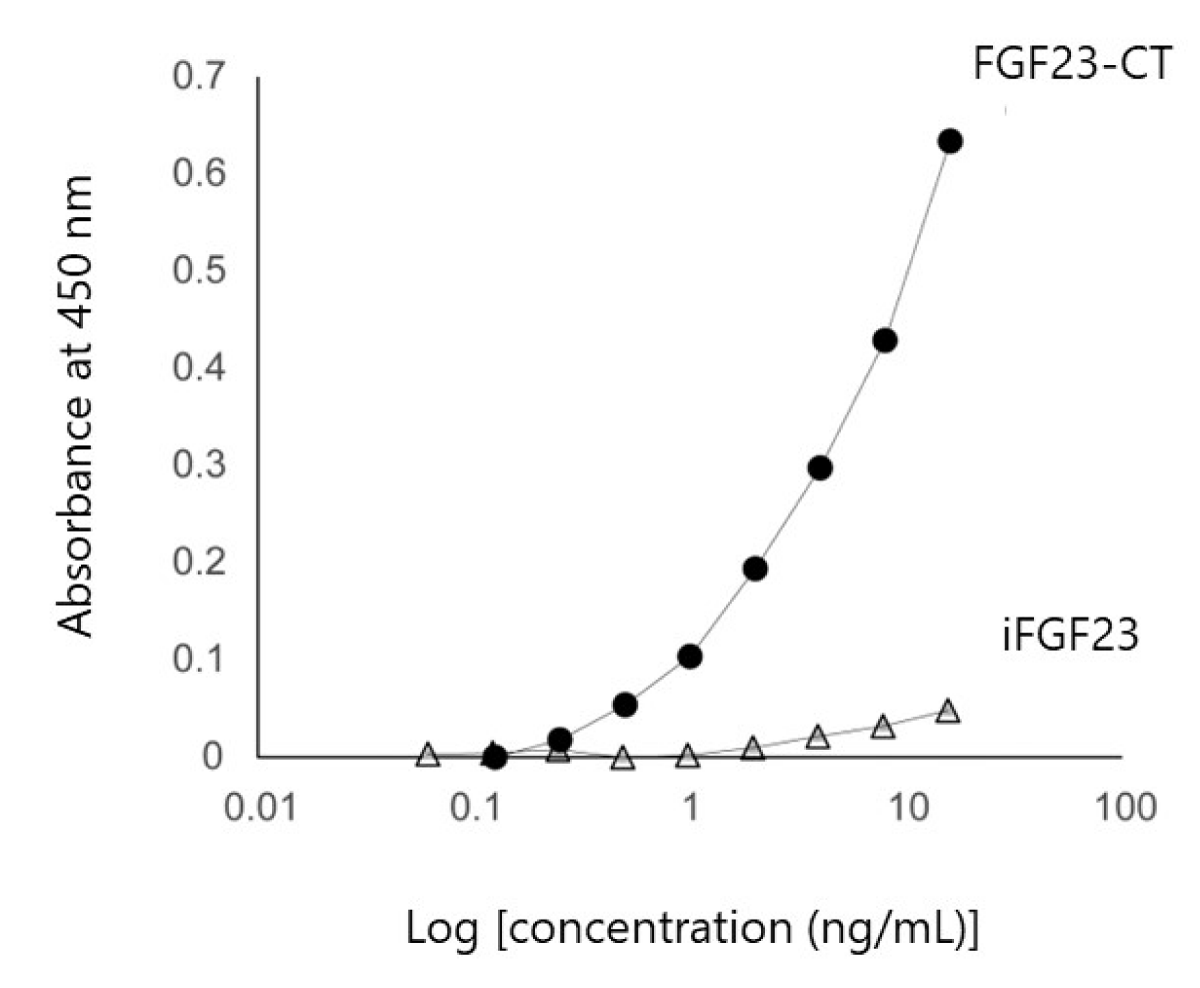
Figure 1: Verification of affinity column absorptive capacity for iFGF23. Quantitation of iFGF23 and FGF23-CT via ELISA. The optical density for the low detection limit was 0.03. iFGF23 assays were below the detection limit up to 15.6 ng/mL, but FGF23-CT assays showed a good reference line up to 8 ng/mL. Abbreviations: FGF23: Fibroblast Growth Factor 23; iFGF23: intact FGF23; FGF23-CT: FGF23 C-Terminal Fragment.
Baseline laboratory data
Table 1 provides baseline laboratory data for HD patients. The mean serum concentrations of corrected calcium (cCa) and Pi were 9.1 mg/dL and 5.2 mg/dL, respectively. The mean cCa-Pi product value was 46.8. The mean serum value was 0.20 mg/dL (range 0-1.71) (Table 1).
| Table 1: Comparison of the mean laboratory data values for patients with ESRD and healthy volunteers. | ||
| Parameters | Values for patients (n= 97) |
Values for Healthy Volunteers (n= 16) |
| Hemoglobin (g/dL) | 10.9 ± 1.24 | 14.5 ± 1.07 |
| Albumin (g/dL) | 3.63 ± 0.32 | 4.46 ± 0.21 |
| Potassium (mEq/L) | 4.85 ± 0.74 | 4.13 ± 0.33 |
| Urea nitrogen (mg/dL) | 64.4 ± 14.8 | 13.3 ± 3.17 |
| Creatinine (mg/dL) | 10.3 ± 2.69 | 0.76 ± 0.16 |
| Uric acid (mg/dL) | 6.00 ± 1.35 | 5.39 ± 1.22 |
| cCa (mg/dL) | 9.05 ± 0.49 | 9.33 ± 0.38 |
| Pi (mg/dL) | 5.17 ± 1.28 | 3.40 ± 0.41 |
| cCa-Pi products (mg2/dL2) | 46.8 ± 11.6 | 31.8 ± 4.2 |
| C-reactive protein (mg/dL) | 0.20 ± 0.30 | 0.04 ± 0.08 |
| FGF23-CT (pg/mL) | 306.0 ± 205.6 | 189.1 ±120.8 |
| FGF23-CT (pmol/L) | 40.7 ± 27.3 | 25.1 ± 16.1 |
| iFGF23 (pg/mL) | 1759.8 ± 2292.2 | 14.0 ± 14.3 |
| iFGF23 (pmol/L) | 62.9 ± 81.9 | 0.50 ± 0.51 |
| tFGF23 (pmol/L) | 103.5 ± 94.1 | 25.6 ± 15.9 |
| i/CT FGF23 ratio | 1.87 ± 2.94 | 0.03 ± 0.03 |
| i/t FGF23 ratio | 0.44 ± 0.28 | 0.03 ± 0.03 |
| Abbreviations: ESRD: End-Stage Renal Disease; cCA: corrected Calcium; Pi: inorganic Phosphorus; FGF23: Fibroblast Growth Factor 23; FGF23-CT: C-Terminal Fragment of FGF23; iFGF23: intact FGF23; tFGF23: total FGF23; i/t FGF23 ratio: intact/total FGF23 ratio. | ||
FGF23-related parameters
All FGF23-related measurements clearly increased in HD patients compared with those in controls, as follows (all given as means ± SD): serum iFGF23 levels were 14.0 ± 14.3 pg/mL in controls and 1760 ± 2290 pg/mL in HD patients, serum FGF23-CT levels were 189 ± 121 pg/mL in controls and 306 ± 206 pg/mL in HD patients, and serum tFGF23 levels were 25.6 ± 15.9 pmol/L in controls and 103.5 ± 94.1 pmol/L in HD patients. In addition, the i/t FGF23 ratios were 0.03 ± 0.03 in controls and 0.44 ± 0.28 in HD patients (Table 2, Figure 2). We found a high correlation between serum iFGF23 levels and serum tFGF23 levels and serum iFGF23 levels and serum i/t FGF23 ratios, as well (Figure 3).
| Table 2: Multivariate analysis of the i/t FGF23 ratio. | ||||
| Parameters | Estimate | SE | t-value | p- value |
| Pi (mg/dl) | 0.11 | 0.030 | 3.54 | *< 0.001 |
| Saccharated ferric oxide (mg/kg/month) | -0.063 | 0.038 | -1.65 | 0.11 |
| ESA dose (U/kg/week) |
-2.1×10⁻⁵ | 0.00069 | -0.030 | 0.98 |
| Single-pool KT/Vurea | 0.057 | 0.13 | 0.45 | 0.66 |
| pg/mL in HD patients, and serum tFGF23 levels were 25.6 ± 15.9 pmol/L in controls and 103.5 ± 94.1 pmol/L in HD patients. In addition, the i/t FGF23 ratios were 0.03 ± 0.03 in controls and 0.44 ± 0.28 in HD patients (Table 2, Figure 2). We found a high correlation between serum iFGF23 levels and serum tFGF23 levels and serum iFGF23 levels and serum i/t FGF23 ratios, as well (Figure 3). | ||||
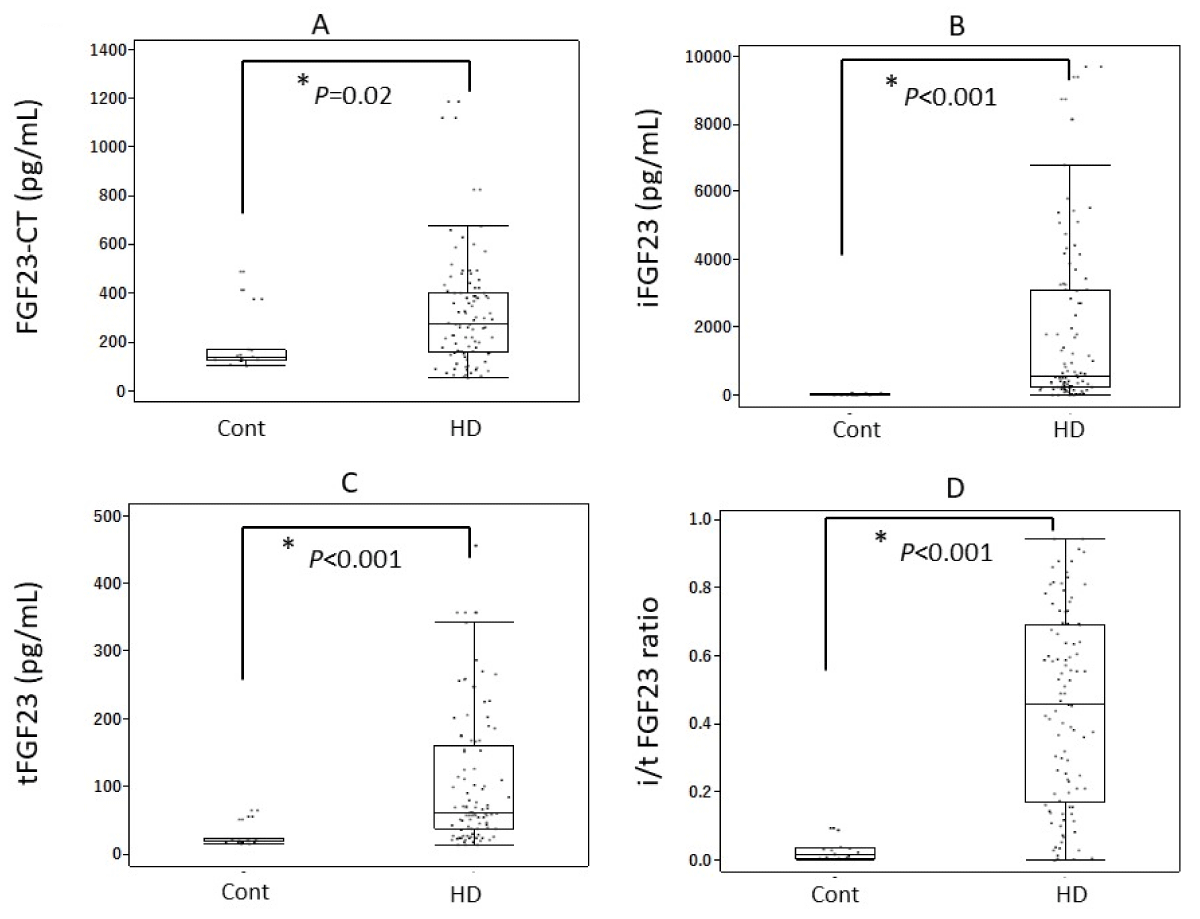
Figure 2: Serum levels of FGF23-related parameters. All such measurements, including the i/t FGF23 ratio, increased significantly in HD patients compared with those in healthy volunteers. (A) FGF23-CT, (B) iFGF-23, (C) tFGF-23, (D) i/t FGF23 ratio. Abbreviations: FGF23: Fibroblast Growth Factor 23; FGF23-CT: FGF23 C-Terminal Fragment; iFGF23: intact FGF23; tFGF23: total FGF23; i/t tFGF23 ratio: intact/total FGF23 ratio; Cont: Healthy Volunteers; HD: Hemodialysis Patients.
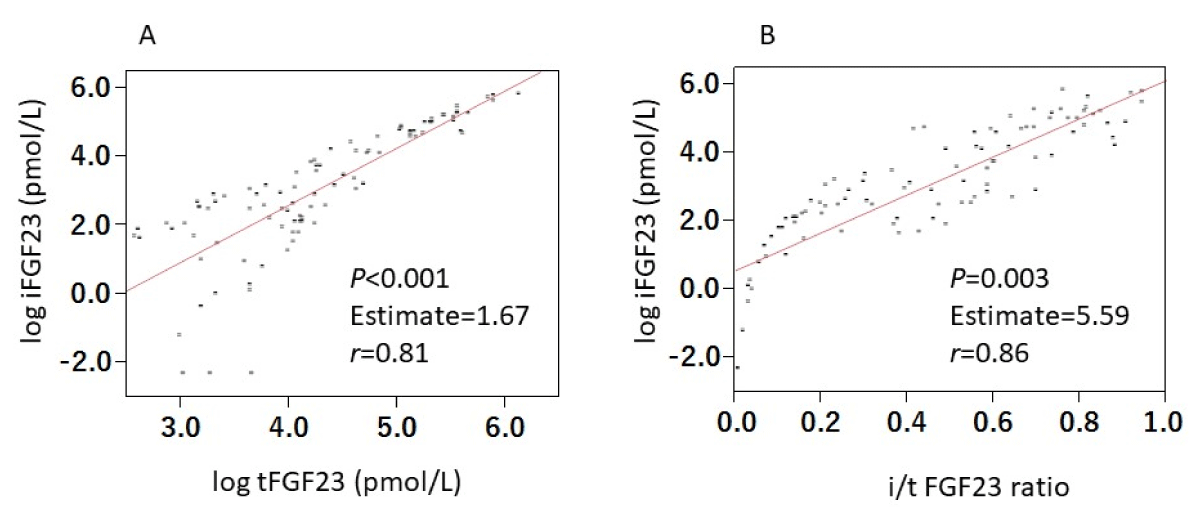
Figure 3: Correlations between iFGF23 and both tFGF23 and i/t FGF23 ratio. Serum levels of iFGF23 correlated both with serum tFGF23 levels (A) and i/t FGF23 ratio (B) significantly. Abbreviations: FGF23: Fibroblast Growth Factor 23; iFGF23: intact FGF23; tFGF23: total FGF23; i/t FGF23 ratio: intact/total FGF23 ratio.
The subject was 49 hemodialysis patients who were treated with both intravenous iron and ESAs. *; statistically significant. Abbreviations: Pi, inorganic phosphorus; FGF23, fibroblast growth factor 23; i/t FGF23 ratio, intact/total FGF23 ratio; ESA, erythropoiesis-stimulating agent; SE, standard error.
Correlation of FGF23-related measurements with both Pi and cCa-Pi products
Serum iFGF23 levels and serum tFGF23 levels, excluding the FGF23-CT, were significantly correlated with Pi and cCa-Pi products (Supplemental Figures 1 and 2).
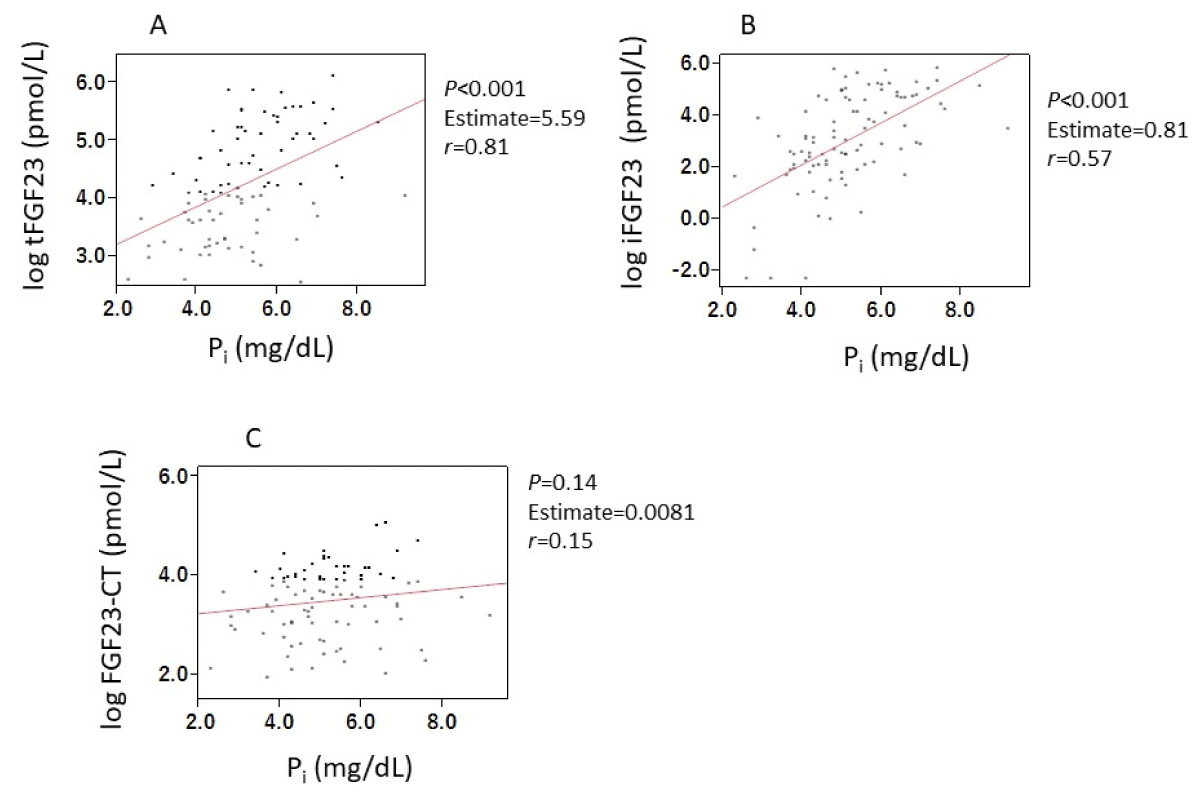
Suppl Figure 1: Correlations between FGF23-related parameters and Pi. Serum levels of iFGF23 (A) and tFGF23 (B), excluding FGF23-CT (C) were significantly correlated with serum Pi concentrations. Abbreviations: FGF23: Fibroblast Growth Factor 23; iFGF23: intact FGF23; tFGF23: total FGF23; FGF23-CT: FGF23 C-Terminal Fragment; Pi: inorganic Phosphate.
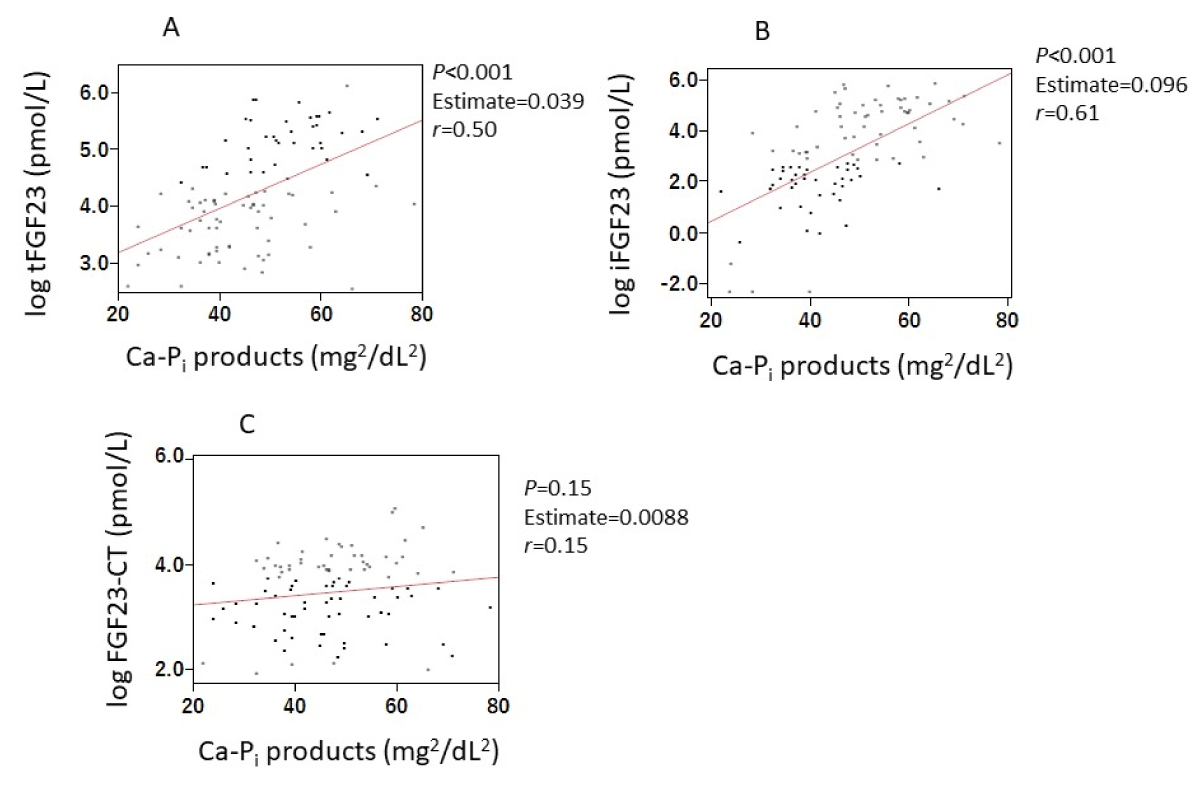
Suppl Figure 2: Correlations between FGF23-related parameters and Ca-Pi products. Serum levels of iFGF23 (A) and tFGF23 (B), excluding FGF23-CT (C) were significantly correlated with Ca-Pi products. Abbreviations: FGF23: Fibroblast Growth Factor 23; iFGF23: intact FGF23; tFGF23: total FGF23; FGF23-CT, FGF23 C-Terminal Fragment; Pi: inorganic Phosphate.
We found positive correlations between the i/t FGF23 ratio and both Pi levels (p < 0.001, r < 0.52) and cCa-Pi products (p < 0.001, r < 0.57) (Figure 4).
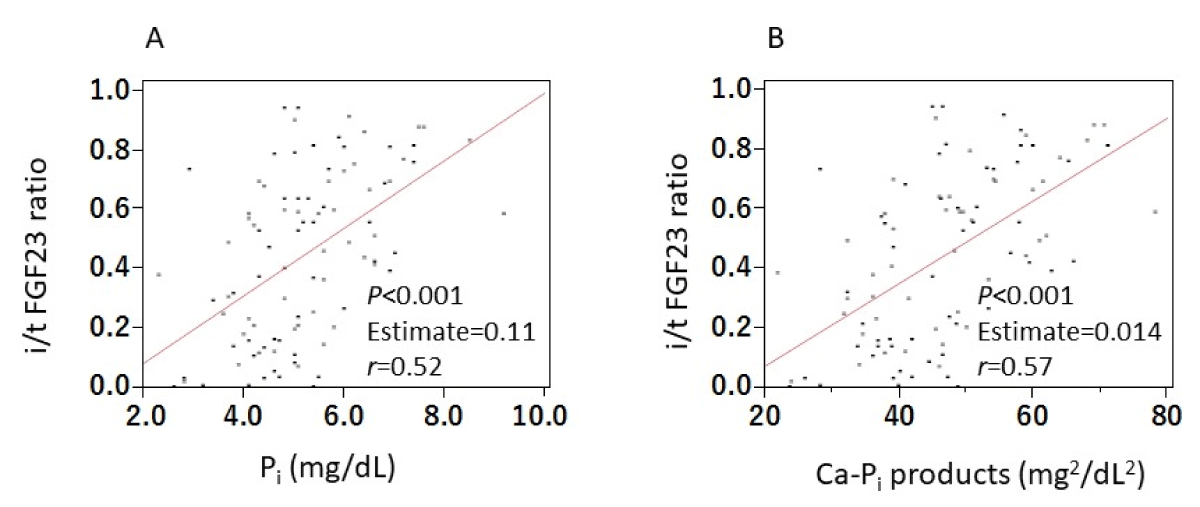
Figure 4: Correlations between i/t FGF23 ratio and both Pi and Ca-Pi products. We found positive correlations between the i/t FGF23 ratio and both Pi levels (A) and cCa-Pi products (B). Abbreviations: FGF23: Fibroblast Growth Factor 23; iFGF23: intact FGF23; tFGF23: total FGF23; i/t FGF23 ratio: intact/total FGF23 ratio; Pi: inorganic Phosphate.
Multivariate analysis
Because FGF23 production and cleavage reportedly varied with iron state and bone marrow activity [8], we also investigated the relationship between the i/t FGF23 ratio and both Pi and cCa-Pi products by means of multivariate analysis. In 49 patients who were treated with both intravenous iron and ESAs, the iron dose given for iron repletion was 1.68 mg/kg/month and the ESA dose was 74.9 U/kg body weight/week. Multivariate analysis showed a positive correlation between the i/t FGF23 ratio and Pi or cCa-Pi products but not the other variables (Table 2 and Supplemental Table 2).
| Supplemental Table 2: Multivariate analysis of the i/t FGF23 ratio. | ||||
| Parameters | Estimate | SE | t-value | p- value |
| cCa-Pi products (mg2/dL2) |
0.014 | 0.0033 | 4.35 | *< 0.001 |
| Saccharated ferric oxide (mg/kg/month) | -0.072 | 0.037 | -1.97 | 0.055 |
| ESA dose (U/kg/week) |
-0.64 × 10⁻⁵ | 0.038 | -1.65 | 0.11 |
| Single-pool Kt/Vurea | 0.057 | 0.13 | 0.45 | 0.66 |
| The subject was 49 hemodialysis patients who were treated with both intravenous iron and ESAs. *; statistically significant. Abbreviations: Pi: inorganic Phosphorus; FGF23: Fibroblast Growth Factor 23; i/t FGF23 ratio: intact/total FGF23 ratio; ESA: Erythropoiesis-Stimulating Agent; SE: Standard Error. |
||||
The present assay system consisted of two processes, i.e., removal of iFGF23 by using an affinity column and subsequent detection of FGF23-CT via ELISA. We thus first confirmed that serum iFGF23 could be completely removed, up to 15.6 ng/mL, which is a much higher amount than values reported for HD patients so far [3]. Therefore, we were able to measure serum levels of only FGF23-CT in this study.
The iFGF23 (aa25-aa251) is produced mainly by osteocytes or osteoblasts. It is cleaved by proprotein convertases (PPCs) such as furin between arginine 179 and serine 180 after posttranslational phosphorylation at serine 180 to generate the N-terminal fragment (aa25-179) and FGF23-CT (aa180-251), which is believed to be important to modulate bioactivity of this molecule [9,10]. Furin has been a well-known PPC, but PPCs have also reportedly been involved in FGF23 cleavage [11]. In patients with CKD, especially HD patients, this cleavage process was shown to be considerably impaired by Smith, et al. [4], who reported that the percentages of circulating FGF23-CT per tFGF23 were roughly 40% in healthy persons, close to 20% in pre-dialysis CKD patients, and 5% in HD patients. In other words, when converted to the i/t FGF23 ratio, the percentages are about 60%, 80%, and 95%, respectively.
However, the extent to which this process is actually impaired has been unclear because of a lack of an assay system specific for FGF23-CT. To our knowledge, this study is the first clinical report to measure serum levels of FGF23-CT directly and exclusively. We suggest three mechanisms by which serum FGF23 levels may be increased in HD patients: stimulated production, insufficient elimination by dialysis, and suppressed breakdown system. As this study shows (Supplemental Figure 1), serum Pi concentrations have been known to be the most important factor to stimulate FGF23 production in CKD. Similarly, among complications associated with HD patients, mild chronic inflammation has also been known to induce FGF23 production and cleavage [12,13]. Although serum C-reactive protein values in this study were not determined by using a highly sensitive assay method, an association with an active but dormant inflammatory process may occur in each patient.
Our results in Figure 3 indicated that serum iFGF23 levels were highly correlated not only with tFGF23 but also with the i/t FGF23 ratio, which suggests the significant involvement of an impaired cleavage process in the increase in serum iFGF23 levels, as well as stimulated production, in this clinical setting.
According to our measurements, the FGF23 cleavage percentage was quite high, up to 97% or so, in healthy volunteers, which was much higher than expected from the report by Smith, et al. [4]. In contrast, in HD patients we found a clear low percentage, as in previous reports. Furthermore, a strong correlation between serum Pi concentrations and the i/t FGF23 ratio (Figure 4A) indicated that increased serum Pi concentrations not only stimulated FGF23 production (Supplemental Figure 1A,B) but also led to impaired FGF23 cleavage in HD patients.
FGF23 undergoes another posttranslational modification besides phosphorylation, i.e., O-glycosylation at threonine 178, which blocks the furin cleavage process. Recently, Takashi, et al. [14] proposed an underlying mechanism by which Pi Augmented O-glycosylation that had been reported earlier by Tagliabracci, et al. [15] and Chefetz, et al. [16]. We therefore believe that the result shown in Figure 4A was consistent with their reports.
In addition, furin activity was activated via a transcription factor, i.e., Hypoxia Inducible Factor (HIF), and our previous study with HepG2 cells had indicated that FGF23 inhibited HIF expression [17]. Therefore, we believe that FGF23 cleavage was suppressed by a reduced expression of HIF in HD patients, especially patients undergoing ESA treatment, which also reportedly inhibited HIF expression [18].
To date, many clinical reports showing involvement of serum Pi concentrations in FGF23 production have been published, but the underlying mechanism by which Pi directly stimulates FGF23 production has remained unclear.
Kuro, et al. recently demonstrated that a nanoparticle, Calciprotein Particle (CPP), which is formed by Ca, Pi and Fetuin A, is an important stimulator of FGF23 production in bone-derived cells at supra-physiological phosphate concentrations of 5.0 mmol/L [19]. Serum Pi concentration is generally much lower than 5.0 mmol/L, even in HD patients. However, our study showed that both iFGF23 and the i/t FGF23 ratio correlated with Ca-Pi products, which suggested that CPP formation may be implicated in the production of FGF23 as well as the suppression of FGF23 cleavage in HD patients. Thus, in HD patients, FGF23 cleavage may be impaired both by reduced expression of HIF and by enhanced posttranslational glycosylation. Therefore, the association of the high Pi concentrations with those two mechanisms in HD patients seems to be important.
Our present FGF23-CT measurements thus confirmed the conventional concept that serum Pi concentration is the most powerful modulator of serum FGF23 levels in HD patients. They also indicated that hyperphosphatemia impaired FGF23 cleavage, which contributed to elevated serum FGF23 levels as well as stimulated production.
FGF23 was recently shown to be implicated as a predictor or a pro-inflammatory causative factor in disorders other than kidney disease [20]. It thus now seems timely to accurately determine serum FGF23-CT levels.
We measured serum FGF23-CT levels in 16 healthy persons and 97 HD patients by using a new commercial kit for the first time. Serum FGF23-CT levels were 189 ng/mL in healthy volunteers and 306 ng/mL in HD patients. Serum iFGF23 levels, however, were 14 ng/mL and 1760 ng/mL, respectively. Thus, the i/t FGF23 ratios were 0.03 and 0.44, respectively. In addition, we believe that hyperphosphatemia in HD patients may be associated with impaired cleavage of FGF23.
This work was supported by the Suiyukai Clinic. The authors would like to thank Ms. Ito (clinical technologist at the Suiyukai Clinic) for her help in collecting samples and the details of the patients.
Author contributions
Conceptualization, K.T., Y.H.; methodology, K.T., Y.H.; formal analysis, K.T., M.T.; investigation, K.T., M.T., Y.M., Y.K.; resources, Y.M.; data curation, K.T., M.T.; Project administration, K.T., Software, K.T., Y.H., Validation, K.T., Visualization, K.T.,Y.H., Supervision, Y.K., Writing---original draft preparation, K.T.; Writing---review and editing, Y.K., Y.H.
Ethics declarations
Ethics approval and consent to participate: The study was conducted according to the guidelines of the Declaration of Helsinki and approved by the Ethics Committee of Suiyukai (protocol code 016, August 15, 2021). Written informed consent was obtained from all the participants involved in the study.
Availability of data and material
The datasets generated and/or analyzed during the current study are available from the corresponding author on reasonable request.
- Isakova T, Xie H, Yang W, Xie D, Anderson AH, Scialla J, Wahl P, Gutiérrez OM, Steigerwalt S, He J, Schwartz S, Lo J, Ojo A, Sondheimer J, Hsu CY, Lash J, Leonard M, Kusek JW, Feldman HI, Wolf M; Chronic Renal Insufficiency Cohort (CRIC) Study Group. Fibroblast growth factor 23 and risks of mortality and end-stage renal disease in patients with chronic kidney disease. JAMA. 2011 Jun 15;305(23):2432-9. doi: 10.1001/jama.2011.826. PMID: 21673295; PMCID: PMC3124770.
- Gutiérrez OM, Mannstadt M, Isakova T, Rauh-Hain JA, Tamez H, Shah A, Smith K, Lee H, Thadhani R, Jüppner H, Wolf M. Fibroblast growth factor 23 and mortality among patients undergoing hemodialysis. N Engl J Med. 2008 Aug 7;359(6):584-92. doi: 10.1056/NEJMoa0706130. PMID: 18687639; PMCID: PMC2890264.
- Komaba H, Fuller DS, Taniguchi M, Yamamoto S, Nomura T, Zhao J, Bieber BA, Robinson BM, Pisoni RL, Fukagawa M. Fibroblast Growth Factor 23 and Mortality Among Prevalent Hemodialysis Patients in the Japan Dialysis Outcomes and Practice Patterns Study. Kidney Int Rep. 2020 Aug 20;5(11):1956-1964. doi: 10.1016/j.ekir.2020.08.013. PMID: 33163716; PMCID: PMC7609896.
- Smith ER, Cai MM, McMahon LP, Holt SG. Biological variability of plasma intact and C-terminal FGF23 measurements. J Clin Endocrinol Metab. 2012 Sep;97(9):3357-65. doi: 10.1210/jc.2012-1811. Epub 2012 Jun 11. PMID: 22689697.
- Tanaka K, Motomiya Y, Kaneko Y, Higashimoto Y, Yoneda T. Serum intact and total fibroblast growth factor 23 levels and iron-related parameters in hemodialysis patients. J Clin Med Res. 2022; 4(5):1–18. https://doi.org/10.37191/Mapsci-2582-4333-4(5)-124.
- Shinzato T, Nakai S, Fujita Y, Takai I, Morita H, Nakane K, Maeda K. Determination of Kt/V and protein catabolic rate using pre- and postdialysis blood urea nitrogen concentrations. Nephron. 1994;67(3):280-90. doi: 10.1159/000187980. PMID: 7936017.
- Bhattacharyya N, Wiench M, Dumitrescu C, Connolly BM, Bugge TH, Patel HV, Gafni RI, Cherman N, Cho M, Hager GL, Collins MT. Mechanism of FGF23 processing in fibrous dysplasia. J Bone Miner Res. 2012 May;27(5):1132-41. doi: 10.1002/jbmr.1546. PMID: 22247037; PMCID: PMC7448291.
- van Vuren AJ, Gaillard CAJM, Eisenga MF, van Wijk R, van Beers EJ. The EPO-FGF23 Signaling Pathway in Erythroid Progenitor Cells: Opening a New Area of Research. Front Physiol. 2019 Mar 26;10:304. doi: 10.3389/fphys.2019.00304. PMID: 30971944; PMCID: PMC6443968.
- Huang X, Jiang Y, Xia W. FGF23 and Phosphate Wasting Disorders. Bone Res. 2013 Jun 28;1(2):120-32. doi: 10.4248/BR201302002. PMID: 26273497; PMCID: PMC4472102.
- Luo Y, Ye S, Li X, Lu W. Emerging Structure-Function Paradigm of Endocrine FGFs in Metabolic Diseases. Trends Pharmacol Sci. 2019 Feb;40(2):142-153. doi: 10.1016/j.tips.2018.12.002. Epub 2019 Jan 4. PMID: 30616873.
- Al Rifai O, Susan-Resiga D, Essalmani R, Creemers JWM, Seidah NG, Ferron M. In Vivo Analysis of the Contribution of Proprotein Convertases to the Processing of FGF23. Front Endocrinol (Lausanne). 2021 Jun 4;12:690681. doi: 10.3389/fendo.2021.690681. PMID: 34149625; PMCID: PMC8213403.
- David V, Martin A, Isakova T, Spaulding C, Qi L, Ramirez V, Zumbrennen-Bullough KB, Sun CC, Lin HY, Babitt JL, Wolf M. Inflammation and functional iron deficiency regulate fibroblast growth factor 23 production. Kidney Int. 2016 Jan;89(1):135-46. doi: 10.1038/ki.2015.290. Epub 2016 Jan 4. PMID: 26535997; PMCID: PMC4854810.
- Francis C, David V. Inflammation regulates fibroblast growth factor 23 production. Curr Opin Nephrol Hypertens. 2016 Jul;25(4):325-32. doi: 10.1097/MNH.0000000000000232. PMID: 27191351; PMCID: PMC5016608.
- Takashi Y, Kosako H, Sawatsubashi S, Kinoshita Y, Ito N, Tsoumpra MK, Nangaku M, Abe M, Matsuhisa M, Kato S, Matsumoto T, Fukumoto S. Activation of unliganded FGF receptor by extracellular phosphate potentiates proteolytic protection of FGF23 by its O-glycosylation. Proc Natl Acad Sci U S A. 2019 Jun 4;116(23):11418-11427. doi: 10.1073/pnas.1815166116. Epub 2019 May 16. PMID: 31097591; PMCID: PMC6561303.
- Tagliabracci VS, Engel JL, Wiley SE, Xiao J, Gonzalez DJ, Nidumanda Appaiah H, Koller A, Nizet V, White KE, Dixon JE. Dynamic regulation of FGF23 by Fam20C phosphorylation, GalNAc-T3 glycosylation, and furin proteolysis. Proc Natl Acad Sci U S A. 2014 Apr 15;111(15):5520-5. doi: 10.1073/pnas.1402218111. Epub 2014 Mar 26. PMID: 24706917; PMCID: PMC3992636.
- Chefetz I, Kohno K, Izumi H, Uitto J, Richard G, Sprecher E. GALNT3, a gene associated with hyperphosphatemic familial tumoral calcinosis, is transcriptionally regulated by extracellular phosphate and modulates matrix metalloproteinase activity. Biochim Biophys Acta. 2009 Jan;1792(1):61-7. doi: 10.1016/j.bbadis.2008.09.016. Epub 2008 Oct 11. PMID: 18976705; PMCID: PMC3169302.
- Higashimoto Y, Tanaka K, Matsui T, Sakaguchi T, Yamagishi S-I, Motomiya Y. Fibroblast growth factor 23 contributes to regulation of hepcidin/ferroportin axis. Austin J Pharmacol Ther. 2020; 8(1):1118. https://austinpublishinggroup.com/pharmacology-therapeutics/journals/ajpt-v8-id1118.pdf.
- Souvenir R, Flores JJ, Ostrowski RP, Manaenko A, Duris K, Tang J. Erythropoietin inhibits HIF-1α expression via upregulation of PHD-2 transcription and translation in an in vitro model of hypoxia-ischemia. Transl Stroke Res. 2014 Feb;5(1):118-27. doi: 10.1007/s12975-013-0312-z. Epub 2013 Nov 27. PMID: 24323731; PMCID: PMC3946340.
- Kuro-O M. Klotho and endocrine fibroblast growth factors: markers of chronic kidney disease progression and cardiovascular complications? Nephrol Dial Transplant. 2019 Jan 1;34(1):15-21. doi: 10.1093/ndt/gfy126. PMID: 29800324.
- Bär L, Stournaras C, Lang F, Föller M. Regulation of fibroblast growth factor 23 (FGF23) in health and disease. FEBS Lett. 2019 Aug;593(15):1879-1900. doi: 10.1002/1873-3468.13494. Epub 2019 Jul 5. PMID: 31199502.