
More Information
Submitted: September 20, 2023 | Approved: September 28, 2023 | Published: September 29, 2023
How to cite this article: Dhar Dwivedi AN, Sharma S, Mishra OP, Singh G. Doppler Evaluation of Renal Vessels in Pediatric Patients with Relapse and Remission in Different Categories of Nephrotic Syndrome. J Clini Nephrol. 2023; 7: 067-072.
DOI: 10.29328/journal.jcn.1001112
Copyright License: © 2023 Dhar Dwivedi AN, et al. This is an open access article distributed under the Creative Commons Attribution License, which permits unrestricted use, distribution, and reproduction in any medium, provided the original work is properly cited.
Keywords: Nephrotic syndrome; Resistive index; Pulsatality index; Ultrasonography

Doppler Evaluation of Renal Vessels in Pediatric Patients with Relapse and Remission in Different Categories of Nephrotic Syndrome
Amit Nandan Dhar Dwivedi1* , Srishti Sharma1, OP Mishra2 and Girish Singh3
1Department of Radiodiagnosis and Imaging, Institute of Medical Sciences, Banaras Hindu University, India
2Department of Pediatrics, Institute of Medical Sciences, Banaras Hindu University, India
3Centre of Biostatistics, Institute of Medical Sciences, Banaras Hindu University, India
*Address for Correspondence: Amit Nandan Dhar Dwivedi, MD, Department of Radiodiagnosis and Imaging, Institute of Medical Sciences, Banaras Hindu University, India, Email: [email protected]
Aim: To study resistivity & pulsatility indices in the interlobar arteries of kidneys in patients with idiopathic nephrotic syndrome and evaluate their response to steroids
Method: The prospective case-control study was carried out in 100 patients, aged 2 years - 15 years of nephrotic syndrome and divided into 5 groups depending upon their response to steroids. Twenty-five age-matched controls were included for comparison. The abdominal ultrasonography and Doppler examinations were performed for patients of each group and for the controls.
Result: The mean Resistivity Index (RI) and Pulsatility Index (PI) of the interlobar arteries were calculated for the five subgroups of nephrotic syndrome patients and for the controls. There was a significant difference in mean RI in all the evaluated arteries between the 6 groups. No significant difference was noted in the pulsatality indices of the kidney of the cases of nephrotic syndrome when compared to controls.
Conclusion: Steroid-resistant nephrotic syndrome patients show a statistically significant difference in RI and not a statistically significant difference in PI Doppler parameters when groups of patients compared to controls. These parameters may be used to predict the response to steroids.
Nephrotic syndrome, also known as nephrosis, is defined as the presence of nephrotic-range proteinuria (> 40 mg/m /hr) or urine protein to creatinine ratio of >2 – 3 mg/mg, hypoalbuminemia (< 2.5 g/dl) and oedema [1]. Nephrotic syndrome is a major cause of chronic renal disease among the paediatric age group. It is basically a manifestation of many glomerular diseases and is a leading cause of significant renal morbidity and mortality in India [2]. Other clinical conditions like hyperlipidemia and hypercoagulability may also be present. The average incidence of nephrotic syndrome is 2 - 16.9 per 100,000 children worldwide [3]. There is epidemiological evidence of a higher incidence of nephrotic syndrome in children from South Asia [4]. The condition is primary (idiopathic) in 95 percent of cases. An underlying disorder that might be identified in less than 5 percent of cases includes systemic lupus erythematosus, Henoch Schonlein purpura, amyloidosis, and infection with HIV, parvovirus B19 and hepatitis B and C viruses [5] Grey scale sonography is routinely performed during the initial evaluation of native renal dysfunction. Basic anatomic information is obtained with USG modality: renal length, cortical thickness, and grade of collecting system dilatation. Although these findings may help in evaluating disease chronicity, often the findings of sonography are normal despite severe renal dysfunction. A series of articles published during the past decade indicated the potential of Doppler sonography for improving the sonographic assessment of renal dysfunction. Changes in intrarenal Doppler waveforms were shown to be associated with several types of intrinsic renal disorders and renal vascular disease. The Doppler Resistive Index (RI) is a useful parameter for quantifying the alterations in renal blood flow that may occur with renal disease. Renal Resistivity index (RI) has been shown to be a prognostic instrument in assessing the progression of renal disease, especially in hypertension, as well as proteinuria. An initially high RI denotes a poor prognosis and indicates more rapid disease progression. However, there are very limited studies on renal Resistivity Index (RI) and Pulsatility Index (PI) in nephrotic syndrome. The aim of this study was to find out if ultrasound and Doppler indices can be used to predict the outcome monitor the progression and regression of nephrotic syndrome among the paediatric age group and assess its inter-group correlation with respect to steroids.
Aims and objectives
The present study was undertaken with the objective of assessing grey scale sonography findings and Resistivity & Pulsatility Indices (RI & PI) in the interlobar arteries of kidneys in patients with idiopathic nephrotic syndrome and evaluating their responsiveness to steroids.
The present prospective case-control study was carried out for consecutive three years in the Department of Radiodiagnosis and Imaging in collaboration with the Department of Paediatrics, Sir Sunderlal Hospital, Institute of Medical Sciences, BHU, Varanasi.
Subject selection
A total of 100 patients with clinical and biochemical features of nephrotic syndrome were included in this prospective study. The study protocol was approved by the Institute Ethical Committee of the Institute of Medical Sciences, Banaras Hindu University (Dean/2015-16/EC/525), and patients were enrolled after obtaining informed consent from their parents/guardians. The patients were divided into 5 groups depending upon their response to steroids, namely:
- Group 1: Patients with first episode of nephrotic syndrome in remission i.e. patients whose three consecutive urine samples showed nil albumin after steroid treatment.
- Group 2: Infrequent relapsers i.e. patients who had previously been in remission and whose urine samples are now positive for albumin (+++)
- Group 3: Frequent relapsers i.e. patients having 2 or more relapses in 6 months or 3 or more in a year.
- Group 4: Steroid dependent i.e. patients with urine positive for albumin (+++) within 14 days of stoppage of steroids or as soon as the patient is transferred to alternate day treatment.
- Group 5: Steroid resistant i.e. patients with urine positive for albumin (+++) despite 4 weeks of steroid therapy
Inclusion criteria
- Patients in the age group of 2 years ‐ 15 years
- Patients with clinical and biochemical features of nephrotic syndrome i.e. Oedema, nephrotic range proteinuria (>40 mg/m²/h on the timed sample, spot albumin to creatinine ratio >2 mg/m2); hypoalbuminemia (<2.5 g/dl) under treatment.
Exclusion criteria
- Patients with congenital nephrotic syndrome
- Patients with secondary nephrotic syndrome
- Patients <2 years or > 15 years of age
- Patients with active urinary sediments who subsequently required kidney biopsy.
Selection of controls
Twenty-five healthy children between the age group of 2 and 15 years with no clinical or biochemical features of nephrotic syndrome were also included in this study for the purpose of comparison.
Ultrasonography
The abdominal ultrasonography examinations were performed using PHILIPS IU 22 for patients of each group and for the controls. The scans were performed using both linear and convex probes having a frequency range of 5 - 17 MHz and 2 - 5 MHz, respectively. All grey scale findings like renal size, corticomedullary differentiation, cortical echogenicity, presence of ascites, and subcutaneous edema were documented. The kidneys were assessed in the transverse and coronal planes with patients in either supine, lateral decubitus position, or prone positions as necessary. Both right and left kidneys were observed and analyzed in each of the patients and control subjects. Renal length was measured in the coronal plane with the patient in a lateral position with breath holding in inspiration. The cortical echogenicity was graded in comparison to the echogenicity of the liver: grade 1 being cortical echogenicity less than the liver, grade 2 cortical echogenicity same as the liver, and grade 3 cortical echogenicity more than the liver. Doppler examination was done with a patient in a supine position with his head elevated to about 30 degrees. A Convex probe (2.5 ‐ 5.0 MHz) was used to identify the segmental arteries and the sample volume was applied such that almost the entire arterial diameter was covered. The Pulse Repetition Frequency (PRF) and the wall filter were adjusted and optimized so as to avoid aliasing and allow for slow diastolic flow. Doppler angle was also kept below 60 degrees. Three consecutive Doppler spectral patterns of the velocity‐time graph, that was representative of the arterial blood flow from early systolic to end of diastolic flow, were obtained before the RI and PI parameters were measured. The RI and PI of upper, middle, and lower pole renal segmental arteries were assessed for each kidney, and the average of the measurements was taken. Doppler parameters were measured at breath holds, especially in children who could cooperate with instructions. However, in younger children, measurements were derived during slow respiration.
Statistical analysis
The statistical analysis was done using the SPSS 15.0 version for Windows. To see the difference between mean groups, an ANOVA test was applied. Further post hockey test was used to evaluate the difference between individual groups with each other. A p - value of < 0.05 was considered statistically significant.
Out of 100 cases of nephrotic syndrome and 25 controls, two cases had to be excluded because they had secondary nephrotic syndrome which was not detected at the time of admission. The cases were divided into five groups depending on the basis of their responsiveness to steroids, as detailed earlier. Out of the 98 cases of nephrotic syndrome, 34.6% were patients with the First Episode of Nephrotic Syndrome (FENS), 23.4% were patients with Infrequently Relapsing Nephrotic Syndrome (IRNS), 14.2% were patients with Frequently Relapsing Nephrotic Syndrome (FRNS), 8.1% were patients with Steroid-Dependent Nephrotic Syndrome (SDNS) and 19.3% were patients with Steroid-Resistant Nephrotic Syndrome (SRNS). The patients were receiving symptomatic treatment. The steroid being given to the patients was prednisolone. Immunosuppressants were used in the frequently relapsing and steroid-resistant groups. The studied cases had a male preponderance with 67.3% of patients being males and 32.7% of patients being females. Amongst controls, 52% were males and 48% were females. The mean age of the patients was 6.023 ± 3.384 years and of controls was 3.780 ± 2.072 years. The mean weight of the patients was 19.137 ± 5.854 kg and for controls was 19.178 ± 6.965 kg. Amongst patients, the mean weight was highest for the steroid-resistant group (24.242 ± 7.446 kg) and minimum for patients with first-episode nephrotic syndrome (16.405 ± 6.464 kg). The mean systolic blood pressure of the patients was 101.84 ± 15.468. The mean systolic blood pressure of controls was 100.12 ± 21.102. The mean diastolic blood pressure of the patients was 68.11 ± 5.227. The mean diastolic blood pressure of controls was 70.11 ± 5.21. There was no statistically significant difference between the systolic or diastolic blood pressure of cases and controls. Renal biopsies were performed in patients where clinically indicated. However, histopathological results were not followed up because they were not relevant to our study.
The mean RI and PI of the interlobar arteries at the upper, mid, and lower poles of the right and left kidneys were calculated for the five subgroups of nephrotic syndrome patients and for the controls. The mean and standard deviation of RI and PI for the upper, mid, and lower poles of the right and left kidneys were calculated. (Tables 1,2) The difference between the groups has been observed as statistically significant for mean RI at the upper, mid, and lower poles of the right kidney and only the upper pole of the left kidney. The post hoc test using Tukey’s test has shown a statistically significant difference in mean RI of the Upper Pole and Lower Pole of a right kidney when Group-V (SRNS) is compared with groups I, II, III, IV and I, II, IV, VI respectively. Further, the difference in mean RI has also been observed as statistically significant when Group V is compared to Group VI (control) of the mid pole of the right kidney (Figure 1) and Group I of the upper pole of the left kidney. However, the difference between mean PI has been observed as not statistically significant between the groups for any pole of the right as well left kidney. There was a significant difference in mean RI in all the evaluated arteries between the 6 groups. The patients with steroid-resistant nephrotic syndrome showed significantly increased resistivity index in the upper pole of the right kidney (Figure 2) when compared to patients of first episode nephrotic syndrome (p value < 0.001), infrequently relapsing nephrotic syndrome (p = 0.042), frequently relapsing nephrotic syndrome (p = 0.016), steroid-dependent nephrotic syndrome (p = 0.045) and controls (p = 0.001). These patients also showed significantly increased resistivity index in the lower pole (Figure 3) when compared to patients of first episode nephritic syndrome (p value < 0.001), infrequently relapsing nephrotic syndrome (p = 0.029), steroid-dependent nephrotic syndrome (p = 0.030) and controls (p = 0.002). The patients with steroid-resistant nephrotic syndrome showed significantly increased resistivity index in the upper pole when compared to patients of first episode nephrotic syndrome (p value < 0.001), frequently relapsing nephrotic syndrome (p 0.025), steroid-dependent nephrotic syndrome (p = 0.025) and controls (p = 0.001). These patients also showed significantly increased resistivity index in the midpole when compared to patients of first episode nephrotic syndrome (p value < 0.001), infrequently relapsing nephrotic syndrome (p = 0.002), frequently relapsing nephrotic syndrome (p < 0.001), steroid-dependent nephrotic syndrome (p = 0.014) and controls (p < 0.001). Significantly increased resistivity index was also noted in the lower pole of these patients when compared to patients of first episode nephrotic syndrome (p value < 0.001), infrequently relapsing nephrotic syndrome (p < 0.001), frequently relapsing nephrotic syndrome (p < 0.001), steroid-dependent nephrotic syndrome (p < 0.001) and controls (p < 0.001). No significant difference was noted in the pulsatality indices of the upper, mid, and lower poles of bilateral kidneys in cases of nephrotic syndrome when compared to the control.
| Table 1: The mean Resistivity index of upper, mid and lower poles of bilateral kidneys for all six groups is shown. | ||||||
| GROUPS | Interlobar Artery Renal Resistive Index (RI) Mean ± SD | |||||
| Right Kidney | Left Kidney | |||||
| UP | MP | LP | UP | MP | LP | |
| Group - I FENS (n = 34) | 0·588 ± 0.030 | 0·594 ± 0·030 | 0·589 ± 0·029 | 0·591 ± 0·030 | 0·588 ± 0·027 | 0·594 ± 0·027 |
| Group - II IRNS (1 = 23) | 0·600 ± 0.035 | 0·606 ± 0·035 | 0·597 ± 0·035 | 0·603 ± 0·032 | 0·601 ± 0·030 | 0·603 ± 0·027 |
| Group - III FRNS (n = 14) | 0·593 ± 0.034 | 0·599 ± 0·029 | 0·596 ± 0·030 | 0·595 ± 0·039 | 0·583 ± 0·020 | 0·598 ± 0·021 |
| Group - IV SDNS (n = 19) | 0·590 ± 0.129 | 0·589 ± 0·017 | 0·586 ± 0·015 | 0·587 ± 0·036 | 0·595 ± 0·018 | 0·587 ± 0·015 |
| Group - V SRNS (n = 19) | 0·629 ± 0.032 | 0·615 ± 030· | 0·627 ± 0·032 | 0·623 ± 0·039 | 0·611 ± 0·038 | 0·611 ± 0·042 |
| Group - VI Control (1 = 25) | 0·590 ± 0.022 | 0·589 ± 0·021 | 0·590 ± 0·030 | 0.594 ± 0.037 | 0·590 ± 0·029 | 0·591 ± 0·024 |
| Between the group comparison one way ANOVA | F = 5·137 Þ = 0·000 |
F = 2·436 Þ = 0·039 |
F = 4·499 Þ = 0·001 |
F = 2·467 Þ = 0·037 |
F = 2·302 Þ = 0·049 |
F = 1·665 Þ = 0·149 |
| Tukey’s post hoc test significant pairs of group p < ·05 | (I, V) (II, V) (III, V) (IV, V) |
(V, VI) | (I, V) (II, V) (IV, V) (V, VI) |
(I, V) | - | - |
| Table 2: Mean values (+SD) of PI for upper, mid and lower poles of bilateral kidneys for all six groups is shown. | ||||||
| GROUPS | Pulsatility Index (PI) Mean ± SD | |||||
| Right Kidney | Left Kidney | |||||
| UP | MP | LP | UP | MP | LP | |
| Group - I FENS (n =34) | 1·089 ± 0.155 | 1·085 ± 0.135 | 1·086 ± 0.131 | 1·077 ± 0.131 | 1·074 ± 0.148 | 1·055 ± 0.121 |
| Group - II IRNS (n = 23) | 1·108 ± 0.155 | 1·103 ± 0.141 | 1·112 ± 0.145 | 1·067 ± 0.141 | 1·107 ± 0.143 | 1·132 ± 0.153 |
| Group - III FRNS (n =14) | 1·137 ± 0.160 | 1·109 ± 0.153 | 1·144 ± 0.158 | 1·074 ± 0.130 | 1·083 ± 0.146 | 1·134 ± 0.141 |
| Group - IV SDNS (n = 19) | 0·991 ± 0.051 | 0·991 ± 0.059 | 1·000 ± 0.056 | 1·121 ± 0.172 | 1·084 ± 0.153 | 1·074 ± 0.160 |
| Group - V SRNS (n = 25) | 1·087 ± 0.119 | 1·120 ± 0.136 | 1·084 ± 0.117 | 1·126 ± 0.131 | 1·146 ± 0.133 | 1·118 ± 0.128 |
| Group - VI control(n =25) | 1·073 ± 0.142 | 1·040 ± 0.109 | 1·072 ± 0.131 | 1·045 ± 0.116 | 1·139 ± 0.107 | 1·050 ± 0.118 |
| Between compression one way ANOVA | F = 1·198 Þ = 0·314 |
F = 1·875 Þ = 0·104 |
F = 1·444 Þ = 0·214 |
F = 0·997 Þ = 0·423 |
F = 1·461 Þ = 0·208 |
F = 1·882 Þ = 0·103 |
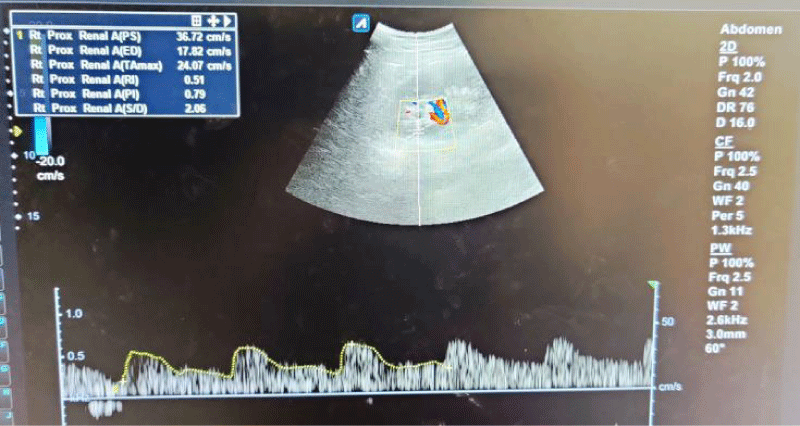
Figure 1: Spectral waveforms of mid-pole interlobar renal artery showing Resistivity Index (RI) and Pulsatility Index (PI) and other Doppler indices (PS: Peak Systolic Velocity, ED: End-Diastolic Velocity, S/D: Systolic Diastolic Ratio, TA max: Time Average Mean Velocity).
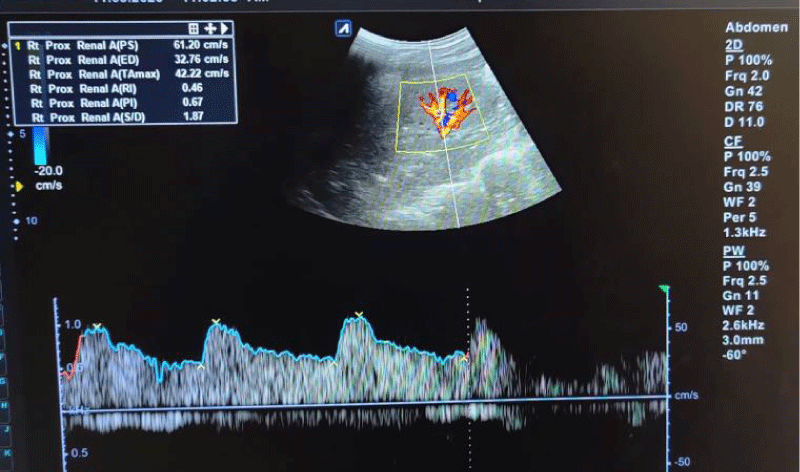
Figure 2: Spectral waveforms of upper pole interlobar renal artery showing Resistivity Index (RI) and Pulsatility Index (PI) and other Doppler indices (PS: Peak Systolic Velocity, ED: End-Diastolic Velocity, S/D: Systolic Diastolic Ratio, TA max: Time Average Mean Velocity).
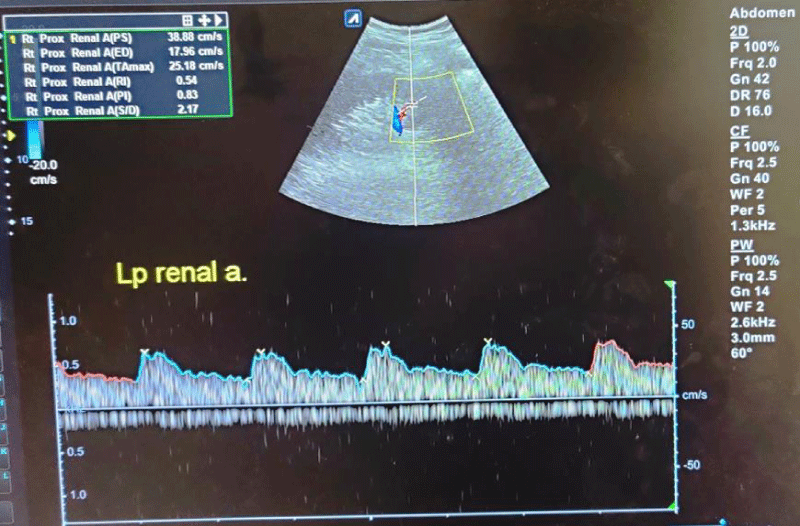
Figure 3: Spectral waveforms of lower pole interlobar renal artery showing Resistivity Index (RI) and Pulsatility Index (PI) and other Doppler indices (PS: Peak Systolic Velocity, ED: End-Diastolic Velocity, S/D: Systolic Diastolic Ratio, TA max: Time Average Mean Velocity).
Nephrotic syndrome is a major cause of chronic kidney disease among the paediatric age group [1]. Nephrotic syndrome as a cause of renal parenchymal disease gives various sonographic patterns which include changes in parenchymal echogenicity, corticomedullary differentiation, and renal size. In addition, the renal resistive index has been shown to be of high prognostic value in chronic kidney disease, especially in proteinuric states to which Nephrotic syndrome belongs. This study was able to document the normal parameters of renal interlobar arteries RI and PI as a reference for comparison with the parameters in children with nephrotic syndrome.
In our study, 56% of the patients with steroid-resistant nephrotic syndrome showed raised cortical echogenicity and accentuated cortico-medullary differentiation, on grey-scale ultrasonography. This was in concordance with the retrospective case review of 43 children, performed by Gershen, et al. [6] with primary nephrotic syndrome which was designed to evaluate the relationship among renal ultrasound findings at presentation, subsequent corticosteroid responsiveness, and histological diagnoses. Gershen, et al. [6] found although the presence of echogenic kidneys did not denote a particular type of renal disease, it was significantly more frequent in corticosteroid‐resistant than in corticosteroid-responsive patients (62% vs. 18%, p < 0.05). Hence, increased renal echogenicity at the time of presentation is a possible indicator of corticosteroid resistance in children with primary nephrotic syndrome.
Renal Resistive Index (RI) has been shown as a prognostic instrument in assessing the progression of renal disease, especially in hypertension, as well as proteinuria [7]. Studies have demonstrated that high RI, proteinuria, and hypertension are known risk factors for the progression of chronic kidney disease, though an association between RI and specific histological subtypes has not been shown to be of statistical significance [7-9]. An initially high RI denotes a poor prognosis [7]. This eventually leads to more rapid disease progression. Atalabi, et al. [10] in their study on Renal Doppler Indices in Children with Nephrotic Syndrome found that the mean RI on the right and left were 0.59 ± 0.06 and 0.58 ± 0.06 respectively for the NS cases whereas for the controls it was 0.61 ± 0.05 and 0.60 ± 0.04 on the right and left respectively. The mean PI on the right and left measured 0.96 ± 0.16 and 0.94 ± 0.15 respectively for the NS cases while that for the control cases measured 0.98 ± 0.13.and 0.95 ± 0.12 on the right and left respectively. In their study, the mean RIs of interlobar arteries were generally less than that for the controls and only the left middle pole showed a statistically significant mean difference (p = 0.004). In our study, however, the values of the mean RI and PI were comparable between the cases and controls in the patients of First episode and relapsing nephrotic syndrome. The patients with steroid-resistant nephrotic syndrome who showed increased cortical echogenicity on grey scale ultrasound also showed a statistically significant increase in the values of RI but not PI when compared to the other groups and controls as described previously. This could be due to the long protracted course of the disease in patients with steroid-resistant nephrotic syndrome [11]. No such studies have been done in the past that specifically compare the Doppler parameters of steroid-resistant nephrotic syndrome with steroid-sensitive nephrotic syndrome patients. Hence no further comparison could be made.
Steroid-resistant nephrotic syndrome patients show significant differences in RI though not significant differences in PI as compared to other groups of patients and controls. These Doppler indices can be used as an objective tool to predict the outcome and monitor the progression and regression of nephrotic syndrome among the paediatric age group and assess its inter-group correlation with respect to steroids. A lead can be taken from the result obtained in this study for planning and carrying out more elaborate studies in the future by other researchers.
- Niaudet P, Gagnadoux MF, Broyer M. Treatment of childhood steroid-resistant idiopathic nephrotic syndrome. Adv Nephrol Necker Hosp. 1998;28:43-61. PMID: 9889985.
- Hussain N, Zello JA, Vasilevska-Ristovska J, Banh TM, Patel VP, Patel P, Battiston CD, Hebert D, Licht CP, Piscione TD, Parekh RS. The rationale and design of Insight into Nephrotic Syndrome: Investigating Genes, Health and Therapeutics (INSIGHT): a prospective cohort study of childhood nephrotic syndrome. BMC Nephrol. 2013 Jan 26;14:25. doi: 10.1186/1471-2369-14-25. PMID: 23351121; PMCID: PMC3608224.
- Chanchlani R, Parekh RS. Ethnic Differences in Childhood Nephrotic Syndrome. Front Pediatr. 2016 Apr 19;4:39. doi: 10.3389/fped.2016.00039. PMID: 27148508; PMCID: PMC4835686.
- McKinney PA, Feltbower RG, Brocklebank JT, Fitzpatrick MM. Time trends and ethnic patterns of childhood nephrotic syndrome in Yorkshire, UK. Pediatr Nephrol. 2001 Dec;16(12):1040-4. doi: 10.1007/s004670100021. PMID: 11793096.
- Bagga A, Srivastava RN. Nephrotic syndrome. In: Srivastava RN, Bagga A, editors. Pediatric Nephrology. 4th ed. New Delhi. Jaypee. 2005; 159-200.
- Gershen RS, Brody AS, Duffy LC, Springate JE. Prognostic value of sonography in childhood nephrotic syndrome. Pediatr Nephrol. 1994 Feb;8(1):76-8. doi: 10.1007/BF00868271. PMID: 8142233.
- Parolini C, Noce A, Staffolani E, Giarrizzo GF, Costanzi S, Splendiani G. Renal resistive index and long-term outcome in chronic nephropathies. Radiology. 2009 Sep;252(3):888-96. doi: 10.1148/radiol.2523080351. Epub 2009 Jun 15. PMID: 19528356.
- Radermacher J, Chavan A, Schäffer J, Stoess B, Vitzthum A, Kliem V, Rademaker J, Bleck J, Gebel MJ, Galanski M, Brunkhorst R. Detection of significant renal artery stenosis with color Doppler sonography: combining extrarenal and intrarenal approaches to minimize technical failure. Clin Nephrol. 2000 May;53(5):333-43. PMID: 11305806.
- Sugiura T, Wada A. Resistive index predicts renal prognosis in chronic kidney disease. Nephrol Dial Transplant. 2009 Sep;24(9):2780-5. doi: 10.1093/ndt/gfp121. Epub 2009 Mar 23. PMID: 19318356.
- Atalabi OM, Afolabi OS, Asinobi AO. Renal Doppler Indices in Children with Nephrotic Syndrome: Findings from a Tertiary Hospital in Nigeria. Niger J Physiol Sci. 2015 Dec 20;30(1-2):17-23. PMID: 27506166.
- Tsai CW, Kuo CC, Wu CF, Chien KL, Wu VC, Chen MF, Sung FC, Su TC. Associations of renal vascular resistance with albuminuria in adolescents and young adults. Nephrol Dial Transplant. 2011 Dec;26(12):3943-9. doi: 10.1093/ndt/gfr141. Epub 2011 Mar 28. PMID: 21444360.