
More Information
Submitted: March 08, 2021 | Approved: April 07, 2021 | Published: April 08, 2021
How to cite this article: Nasrallah R, Zimpelmann J, Cheff V, Thibodeau JF, Burns KD, et al. Collecting duct PGE2 responses reduce water loss with empagliflozin in mice with type 2 diabetes mellitus. J Clini Nephrol. 2021; 5: 023-030.
DOI: 10.29328/journal.jcn.1001069
Copyright License: © 2021 Nasrallah R, et al. This is an open access article distributed under the Creative Commons Attribution License, which permits unrestricted use, distribution, and reproduction in any medium, provided the original work is properly cited.
Keywords: db/db mice; Empagliflozin; Isolated perfused tubules; Vasopressin; Water transport

Collecting duct PGE2 responses reduce water loss with empagliflozin in mice with type 2 diabetes mellitus
R Nasrallah1, J Zimpelmann2, V Cheff1, JF Thibodeau1, KD Burns1,2 and RL Hébert1*
1Department of Cellular and Molecular Medicine, Faculty of Medicine, University of Ottawa, Canada
2Division of Nephrology, Department of Medicine, Ottawa Hospital Research Institute, Ottawa, ON, Canada
*Address for Correspondence: Richard L Hébert, Ph.D., Department of Cellular and Molecular Medicine, Kidney Research Centre, Faculty of Medicine, University of Ottawa,451 Smyth Road, Room 2514, Ottawa, ON, K1H 8M5, Canada, Tel: (613)-562-5800; ext. 8616; Email: [email protected]
Introduction: Sodium-glucose cotransporter 2 inhibitors such as empagliflozin (EMPA) protect against diabetic kidney disease. Prostaglandin E2 (PGE2) the main renal product of cyclooxygenase-2, inhibits vasopressin (AVP)-water reabsorption in the collecting duct (CD). The novelty of this study is that for the first time, we examined if EMPA affects the renal PGE2/EP receptor system and determined if CD responses to EMPA prevent water loss.
Methods: Four groups of adult male mice were studied after 6 weeks of treatment: control (db/m), db/m+EMPA (10 mg/kg/day in chow), type 2 diabetic diabetic/dyslipidemia (db/db), and db/db+EMPA. Tubules were microdissected for quantitative polymerase chain reaction (qPCR) and CD water transport was measured in response to AVP, with or without PGE2.
Results: Hyperglycemia and albuminuria were attenuated by EMPA. Renal mRNA expression for COX, PGE synthase, PGE2 (EP) receptor subtypes, CD AVP V2 receptors and aquaporin-2 was elevated in db/db mice, but unchanged by EMPA. Urine PGE2 levels increased in db/db but were unchanged by EMPA. AVP-water reabsorption was comparable in db/m and db/m+EMPA, and equally attenuated to 50% by PGE2. In db/db mice, AVP-water reabsorption was reduced by 50% compared to non-diabetic mice, and this reduction was unaffected by EMPA. In db/db mice, AVP-stimulated water transport was more significantly attenuated with PGE2 (62%), compared to non-diabetic mice, but this attenuation was reduced in response to EMPA, to 28%.
Conclusion: In summary, expression of renal PGE2/EP receptors is increased in db/db mice, and this expression is unaffected by EMPA. However, in diabetic CD, PGE2 caused a greater attenuation in AVP-stimulated water reabsorption, and this attenuation is reduced by EMPA. This suggests that EMPA attenuates diabetes-induced excess CD water loss.
Diabetes is the leading cause of chronic kidney disease (CKD), and has reached epidemic status. Among the newest anti-hyperglycemic agents, sodium-glucose cotransporter 2 (SGLT2) inhibitors such as empagliflozin (EMPA) are promising therapeutics, since they not only lower blood glucose by inhibiting proximal tubule glucose uptake, but also reduce adverse metabolic, cardiovascular and renal outcomes [1]. SGLT2 inhibitors reduce glomerular hyperfiltration and proteinuria in human diabetic kidney disease (DKD) [2-4]. Despite these promising benefits in diabetes, their effect on major renal hormonal systems and tubule transport function is not known.
PGE2, the main renal product of cyclooxygenase 2 (COX2), is a key regulator of glomerular hemodynamics and renin secretion, as well as sodium and water transport along the nephron. PGE2 acts on four G protein-coupled EP receptors (EP1-4), which are abundantly expressed in the collecting duct (CD). Our group and others showed that PGE2 stimulates sodium and water reabsorption in the CD via EP4; and promotes natriuresis and diuresis via EP1 and EP3 by antagonizing vasopressin (AVP)-mediated water reabsorption [5-7].
Overall, EP1 and EP3 receptor activation by PGE2 contributes to nephron dysfunction and injury in type 1 diabetes [5,6]. Studies by our group and others showed that enzymes mediating synthesis of renal PGE2 (COX2 and microsomal PGE2 synthase 1) are elevated in type 1 rodent and human DKD, as are urinary PGE2 levels [8-11]. In models of type 1 diabetes, we showed that renal EP1 promotes glomerular filtration barrier and tubular injury, contributing to hyperfiltration and proteinuria, while gene deletion of EP1 deletion is beneficial [12]. We also showed that renal EP3 contributes to polyuria by impacting urine concentrating function in diabetic mice [13]. However, the role of renal PGE2/EP receptors in kidney disease associated with type 2 diabetes is unclear.
The purpose of this study was to examine the effect of EMPA on CD responses to PGE2 in type 2 diabetic (db/db) mice. Though EMPA is nephroprotective in type 2 diabetes, the implications of increasing glucose and fluid delivery along the nephron has not been studied in detail. Therefore, we also examined how EMPA affects the renal PGE2/EP receptor system, and how CD hormonal systems respond to EMPA to prevent excessive water loss.
Type 2 diabetic mice and EMPA treatment
Male db/db mice (BKS.Cg-Dock7m +/+ Leprdb/J; Jackson Labs) and their control heterozygous (db/m) littermates mice, 12 wks-old of age, were studied. We randomly assigned mice into 4 groups: control (db/m), db/m+EMPA, type 2 diabetic (db/db), db/db+EMPA, and administered empagliflozin (EMPA; 10 mg/kg/day; Boehringer-Ingelheim, Germany) in standard chow (prepared by Envigo Labs). The dose of 10 mg/kg/day for 6 wks was chosen according to previous rodent studies [14]. Mice were housed on a 12-hr light-dark cycle, with free access to standard chow and water. Mice were sacrificed by exsanguination under isoflurane anesthesia. All animal procedures were undertaken at the University of Ottawa’s Animal Care and Veterinary Services vivarium and were approved by the University of Ottawa Animal Care Committee.
Mouse characteristics, blood pressure, and urine analysis
The effects of EMPA on various metabolic and renal parameters, body weight and blood glucose were measured. Kidney weights were normalized to body weight. Spot urine was collected at the same time daily. Food and water consumption, and urine volume were monitored daily for 3 consecutive days with one day of acclimation from 24 hrs metabolic cages. Urine parameters analysed included albumin by ELISA (Bethyl Labs, TX, USA), PGE2 levels by ELISA (Cayman Chemicals), and osmolality by freezing point depression (Advanced Model 3MO Plus Osmometer, Advanced Instruments Inc, MA, USA). Values were normalized to creatinine (Exocell Inc).
Determination of glomerular filtration rate (GFR)
GFR was measured in conscious mice by FITC-inulin clearance. Briefly, 5% FITC-inulin (Sigma-Aldrich, St.Louis, MO, USA) dissolved in 0.9% saline was dialyzed overnight and filtered. Mice were injected with 3.74 µl/g BW of FITC-inulin via tail-vein. Blood was collected from the saphenous vein into heparinized capillary tubes after 3, 7, 10, 15, 35, 55 and 75 min, and centrifuged. Samples were buffered in HEPES (500 mM, pH7.4) and fluorescence was measured (excitation 488 nm/emission 538 nm). GFR was calculated using a two-compartment clearance model as previously reported [15].
Quantitative PCR analysis
To examine the expression of renal PGE2/EP receptor systems and water and solute transporters along the nephron, we performed quantitative PCR (qPCR). The left kidneys were dissected to separate cortex and medulla and microdissected tubules (proximal tubule, thick ascending limb, cortical and inner medullary CD), then snap-frozen in liquid nitrogen. Tissue was homogenized using the TP-103 Amalgamator COE Capmixer (GC America Inc, IL, USA). RNA from microdissected tubules was obtained by following the RNAqueous Mini Kit (Invitrogen, MA, USA) according to the manufacturer protocol. Tissue RNA was isolated with TRIzol (Invitrogen, MA, USA). RNA samples were treated with DNAse I (Invitrogen, MA, USA). mRNA was measured by qPCR with the ABI Prism 7000 system using specific primers (Table 1), and the SYBR Advantage qPCR Premix (Clontech Laboratories, CA, USA) according to the manufacturer’s instructions. We measured the expression of PGE2 synthesis enzymes (microsomal PGE2 synthase: mPGES-1 and mPGES-2, cytosolic PGE2 synthase: cPGES, COX1, COX2) and EP1-4 receptors by qPCR. Expression was normalized to 18S RNA and the 2Lepr-ΔΔCT method was used for analysis as done previously [15].

Table 1: Primer sequence for qPCR.
Ex vivo microperfusion of collecting ducts and water transport
Empa is already a well-known anti-diabetic drug to treat type 2 diabetes, but nothing is known in regards of how Empa affects the renal membrane transport in db/db mice. Mice were euthanized after 6 wks EMPA, and IMCD from right kidneys were microdissected for in vitro microperfusions and measurement of net fluid reabsorption (Jv). 3H-inulin (75 µCi/ml) was used as a volume marker. In control periods, two collections were made for calculation of basal Jv following 30 min equilibration. Tubules with a negative basal Jv were discarded. AVP (10-12 mM, Sigma-Aldrich, St. Louis, MO, USA) was added to the bath and four 10-min collections were made. PGE2 (10-7 mM, Sigma-Aldrich, St. Louis, MO, USA) was then added with five additional 10-min collections. Mean Jv was calculated as previously described [15]. Compositions of bath, dissecting, and perfusion solutions have been published [16-18]. For diabetic perfusions, glucose was increased from normal bath of 8.3 to 25 mM. To control for osmotic responses the control group was perfused with 16.7 mannitol + 8.3 mM glucose. The perfusate was hypotonic at 290 vs. 440 mOsm for the bath.
Statistical analysis
Graphpad Prism (San Diego, CA, USA) was used for data analysis. Values are expressed as means ± SEM. Statistical analysis was done using One-way ANOVA followed by Tukey’s post -test. The significance was indicated for p < 0.05. Additionally, a one sample t-test with a hypothetical value of 1 was performed for qPCR.
Physiological parameters, blood pressure, and GFR
To study the effect of type 2 diabetes and EMPA on mouse physiology and renal function, we first measured food and water intake, body weight and blood glucose. As shown in figure 1, food and water intake, body weights, and blood glucose were elevated in db/db mice compared to db/dm. EMPA had no effect on food and water intake or body weight, but significantly lowered blood glucose levels compared to db/db mice.
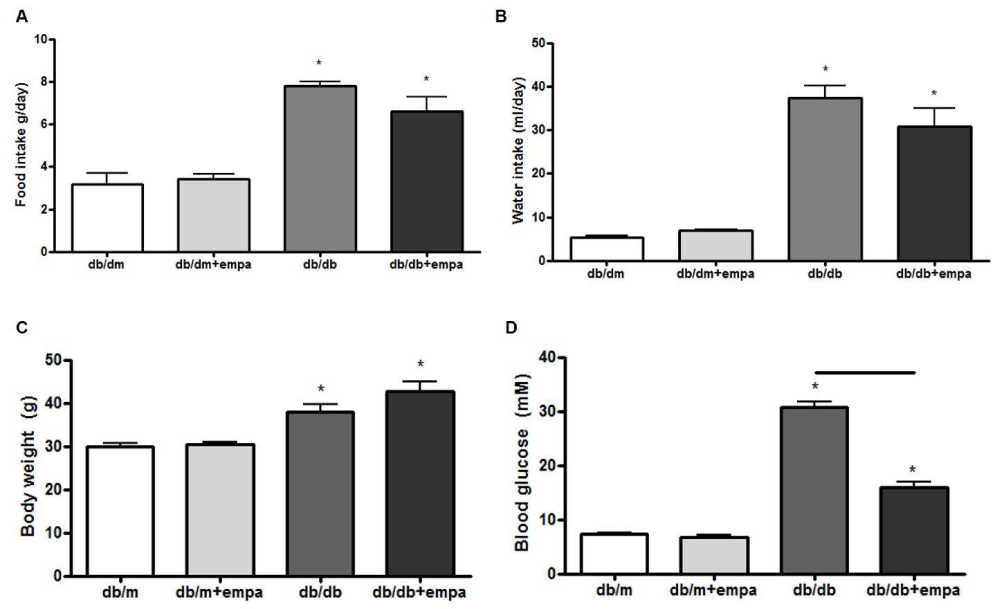
Figure 1: Physiological parameters. Food intake (A), water intake (B), body weight (C), and blood glucose (D) were measured in four mouse groups after 6 wks: control (db/m), db/m+EMPA, diabetic (db/db), and db/db+EMPA. n = 4-9. *p < 0.05 vs. db/m, and black line indicates significance between two groups.
In figure 2A, FITC-inulin clearance was increased up to 500 ul/min in db/db mice compared to 300 ul/min in db/m, but only slightly lower in db/db+EMPA compared to db/db. Urine PGE2 levels were 10-fold higher in db/db mice compared to db/m, but unchanged by EMPA (Figure 2B).
Urine osmolalities were reduced by 50% in db/db mice compared to db/m, but also unaffected by EMPA (Figure 2C). However, urine albumin levels were increased 3-fold in db/db mice and lowered to near control levels by EMPA (Figure 2D).

Figure 2: Kidney function and urine analysis. FITC inulin clearance (A), urine PGE2 (B), urine osmolality (C), and urinary albumin levels (D) were assessed in 4 mouse groups: control (db/m), db/m+EMPA, diabetic (db/db), and db/db+EMPA. Data is presented as mean +/- SEM, n = 7-12. *p < 0.05 vs. db/m p < 0.05, and black line indicates significance between two groups.
Expression of renal cyclooxygenases, PGE2 synthases, and EP receptors
To determine whether the renal PGE2/EP receptor system is altered in type 2 diabetes or in response to EMPA, we characterized the regional and segmental mRNA expression profile of the PGE2 pathway, including the synthetic enzymes: COX1 and COX2 and PGE2 synthases (microsomal mPGES1, mPGES2, and cytosolic cPGES), as well as the four EP receptors (EP1-4).
As shown in figure 3A, cortical COX-1 mRNA was reduced by 50% in all groups compared to db/m, including db/m+EMPA. EMPA did not further lower COX1 in db/db mice. Medullary COX1 mRNA was significantly increased in db/db mice, but unchanged by EMPA (Figure 3B). In comparison, COX2 mRNA was increased in the cortex and medulla of db/db mice by 2.6-fold and 3.5-fold, respectively, compared to db/m; although this was not significant in the medulla (p = 0.06). Levels were similar in db/db and db/db+EMPA (Figure 3C and 3D). Medullary mPGES1 mRNA was also increased in db/db mice compared to db/m, and unchanged by EMPA (Figure 4A,B). However, in the medulla mPGES1 was also increased in db/m+EMPA (Figure 4B) compared to db/m. Renal expression of mPGES2 (Figure 4C,D) and cPGES was similar in all groups (data not shown).

Figure 3: Renal COX gene expression. RNA was isolated from the cortex (A, C) and medulla (B, D) from 4 mouse groups: control (db/m), db/m+EMPA, diabetic db/db, and db/db+EMPA. Cyclooxygenase (COX)-1 and COX2 mRNA were measured by qPCR. Data was normalized to 18S and is presented as fold db/m of mean +/- SEM. *p < 0.05 vs. db/m, n = 4-6.
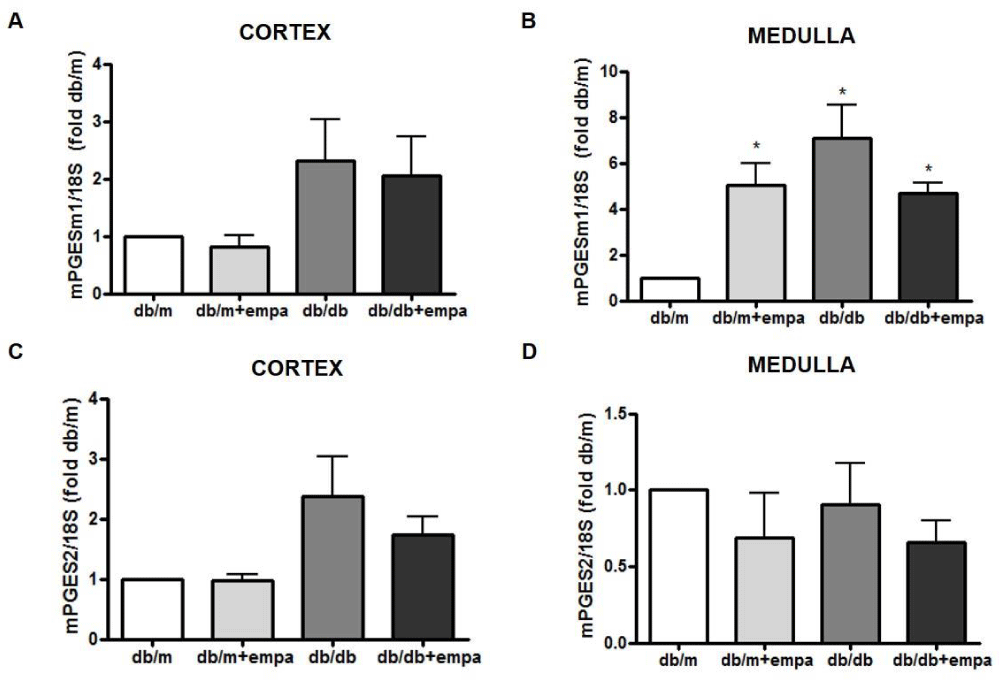
Figure 4: Renal mPGES gene expression. RNA was isolated from the cortex (A, C) and medulla (B, D) from 4 mouse groups: control (db/m), db/m+EMPA, diabetic db/db, and db/db+EMPA. Microsomal PGE2 synthase (mPGES)-1 and 2 mRNA were measured by qPCR. Data was normalized to 18S and is presented as fold db/m of mean +/- SEM. *p < 0.05 vs. db/m, n = 4-6.
EP receptor expression was measured in microdissected proximal tubules (PT), thick ascending limb (TAL), and cortical and inner medullary CD (CCD and IMCD respectively). As shown in figures 5C+D, EP1 mRNA was increased 2-fold in the CCD (p < 0.05) in db/db mice compared to db/m, but unaffected by EMPA. EP1 mRNA was reduced in db/db PT and TAL and unaffected by EMPA, but EP1 was also reduced by 75% in the PT of db/m+EMPA like db/db (Figures 5A,B). EP3 expression was significantly reduced by 50% in the TAL of db/db+EMPA compared to db/m (figure 5F), but otherwise unchanged. EP4 was not detectable in microdissected TAL and CCD. In the PT, EP4 mRNA was reduced over 75% in all groups, and almost undetectable in the db/m+EMPA and db/db compared to db/m (Figure 5I). EP4 was also reduced by 50% in db/m+EMPA compared to db/m in the IMCD, but unchanged in db/db and db/db+EMPA (Figure 5J). EP2 was unchanged in the cortex and medulla in diabetic mice, unaffected by EMPA, and undetectable in micro dissected tubules (data not shown).

Figure 5: Renal EP receptor gene expression. RNA was isolated from microdissected proximal tubules (A, E, I), thick ascending limb (B, F), cortical (C+G) and inner medullary (D, H, J) collecting duct from 4 mouse groups: control (db/m), db/m+EMPA, diabetic db/db, and db/db+EMPA. Expression of EP1 (A-D), EP3 (E-H), and EP4 (I+J) receptor mRNA were measured by qPCR. Data was normalized to 18S and is presented as fold db/m of mean +/- SEM. * p < 0.05 vs. db/m, n = 3-6.
Expression of renal sodium transporters
We examined the mRNA expression of major sodium transporters in the renal cortex and microdissected tubule segments. As shown in figures 6A,B, cortical expression of sodium-hydrogen exchanger (NHE)-3 and epithelial sodium channel (αENaC) were increased 2-fold and 1.8-fold respectively in db/db mice compared to db/m, but unaffected by EMPA. In contrast, cortical sodium-potassium-ATPase was reduced by 40% - 50% in all groups compared to db/m, though the reduction was not significant in db/db+EMPA (Figure 6C).
Next, we showed in microdissected PT that sodium glucose cotransporter SGLT1 mRNA was reduced by 50% in db/m+EMPA compared to db/m, but unaltered in diabetic tubules (Figure 6D). SGLT2 mRNA however was comparable in all groups (Figure 6E). Interestingly, TAL sodium-potassium-2-chloride cotransporter (NKCC2) mRNA was increased 2-fold in both db/m+EMPA and db/db tubules compared to db/m, but the expression returned to control levels in db/db+EMPA (Figure 6F).

Figure 6: Renal sodium transporters gene expression. RNA was isolated from the renal cortex (A-C), and from microdissected proximal tubules (D+E) and thick ascending limb (F) from 4 mouse groups: control (db/m), db/m+EMPA, diabetic db/db, and db/db+EMPA. Expression of sodium-hydrogen exchanger (NHE)-3, epithelial sodium channel (ENaC), sodium-potassium-ATPase (NaK-ATPase), sodium glucose cotransporter (SGLT)-1 and SGLT-2, and sodium-potassium-2-chloride cotransporter (NKCC2) were measured by qPCR. Data was normalized to 18S and is presented as fold db/m of mean +/- SEM. *p < 0.05 vs. db/m, and black line indicates significance between two groups, n = 3-6.
Expression of CD aquaporins, AVP V2 receptor, and urea transporter
We next examined the mRNA expression of cortical and medullary aquaporins (AQP)-1 and AQP2, the two major renal water channels. As shown in figure 7, cortical AQP1 was increased 2.5-fold in db/db+EMPA compared to db/m, and unchanged in the other two groups (Figure 7A). AQP1 was unchanged in both regions in db/db mice. In contrast, AQP2 was increased 4-fold and 2-fold respectively, in the cortex and medulla of db/db mice compared to db/m (Figure 7C,D), however this increase was unaltered by EMPA. AQP2 was unchanged in cortex and medulla of db/m+EMPA.

Figure 7: Renal aquaporin gene expression. RNA was isolated from the cortex (A, C) and medulla (B, D) from 4 mouse groups: control (db/m), db/m+EMPA, diabetic db/db, and db/db+EMPA. Aquaporin (AQP)-1 and 2 mRNA were measured by qPCR. Data was normalized to 18S and is presented as fold db/m of mean +/- SEM. * p < 0.05 vs. db/m, n = 4-6.
We also examined the expression of AVP V2 receptors (V2R) in microdissected cortical and inner medullary CD (CCD and IMCD). As shown in figure 8A, CCD V2R mRNA was increased 3-fold in db/db mice compared to db/m. Moreover, medullary V2R mRNA expression was increase 2.5 fold in db/db and db/db+EMPA compared to db/m (Figure 8B). We also examined the mRNA expression of the urea transporterA1 (UTA1) at the collecting ducts. As shown in figure 8C, UTA1 expression increase by 8 fold in db/db+EMPA compared to db/m, and had little to no expression in the other two groups.
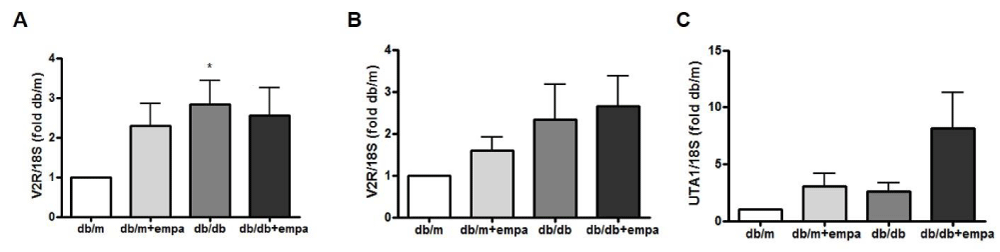
Figure 8: Renal V2R and UTA1 gene expression. RNA was isolated from microdissected cortical (A+B) and inner medullary (C) collecting ducts from 4 mouse groups: control (db/m), db/m+EMPA, diabetic db/db, and db/db+EMPA. Expression of vasopressin V2 receptors (V2R) and urea transporterA1 (UTA1) mRNA were measured by qPCR. Data was normalized to 18S and is presented as fold db/m of mean +/- SEM. * p < 0.05 vs. db/m, n = 5-6.
Collecting duct water transport
Functional studies in isolated perfused IMCD were conducted to determine whether water reabsorption is increased to compensate for the osmotic diuresis induced by EMPA. Our work first determined whether basal water flux is altered in db/db mice, and then how EMPA alters basal water transport. Next, we assessed water flux in response to 10,-8M AVP and AVP+10-7M PGE2. As shown in figure 9, AVP-stimulated water reabsorption was comparable in db/m and db/m+EMPA at around 5 nl/mm/min, and equally attenuated by 45 and 46% respectively by PGE2. In db/db mice, the AVP response was reduced by 50%, and this reduction was unaffected by EMPA. There was a greater attenuation of AVP-mediated water transport in db/db in response to PGE2, by 62%, but this attenuation was reduced in response to EMPA, to 28% in db/db+EMPA.
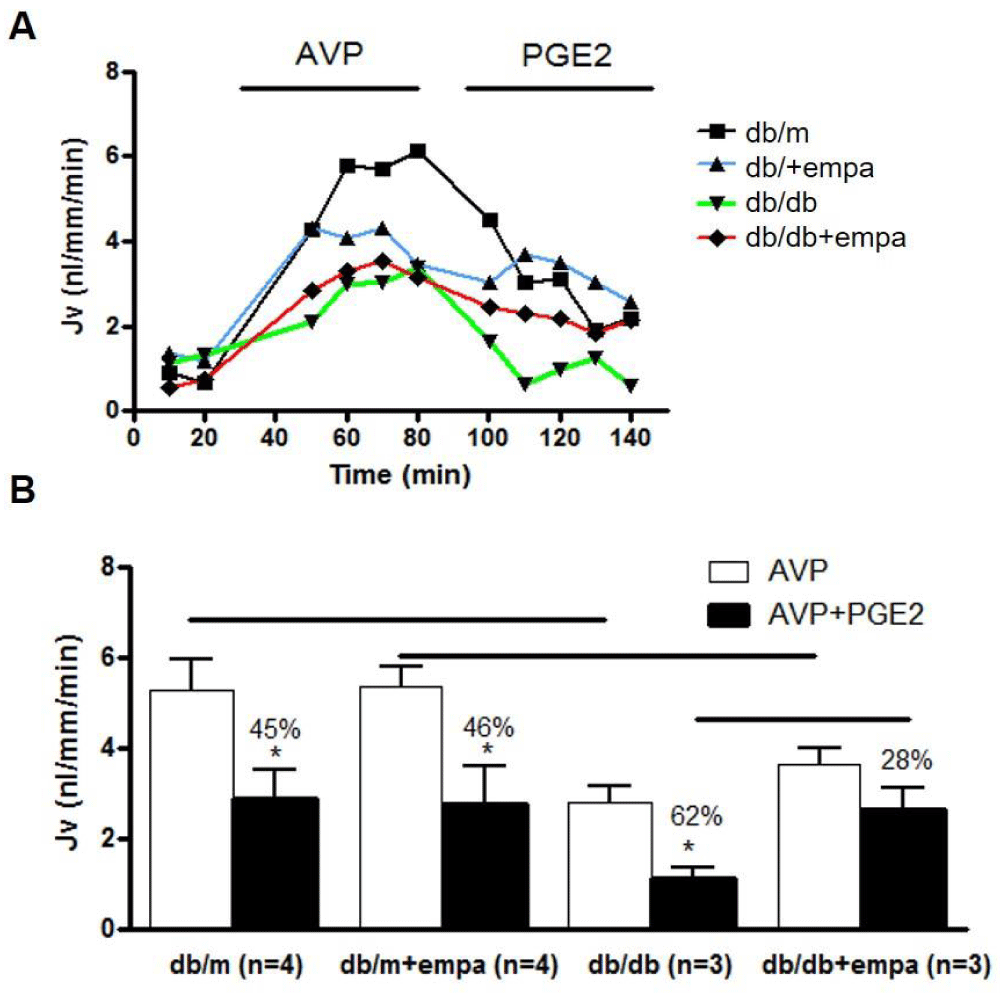
Figure 9: Water transport in microdissected IMCD. Net fluid reabsorption (Jv) was analyzed in 4 mouse groups: control (db/m), db/m+EMPA, diabetic (db/db), and db/db+EMPA. IMCD were microdissected and Jv (nl/mm/min) was determined. Tubules were stimulated with 10-12M AVP followed by AVP+10-7M PGE2. In A) a representative tracing of each group is shown. In B) Jv is shown as mean+/-SEM, white bars for AVP alone and black bars for AVP+PGE2. *p < 0.05 vs. AVP, and significance between groups is indicated with a black line.
Four groups of adult male mice were studied after 6 weeks of treatment: control (db/m), db/m+EMPA (10 mg/kg/day in chow), type 2 diabetic (db/db), and db/db+EMPA. Tubules were microdissected for qPCR and CD water transport was measured in response to AVP, with or without PGE2. Hyperglycemia and albuminuria were attenuated by EMPA. Renal mRNA expression for COX, PGE synthase, EP receptors, CD AVP V2 receptors and aquapoSSSSSrin-2 was elevated in db/db mice, but unchanged by EMPA. Urine PGE2 levels increased in db/db but were unchanged by EMPA. AVP-water reabsorption was comparable in db/m and db/m+EMPA, and equally attenuated to 50% by PGE2. In db/db mice, AVP-water reabsorption was reduced by 50% compared to non-diabetic mice, and this reduction was unaffected by EMPA. In db/db mice, AVP-stimulated water transport was more significantly attenuated with PGE2 (62%), compared to non-diabetic mice, but this attenuation was reduced in response to EMPA, to 28%.
In addition to the classical disturbances implicated in the pathogenesis of DKD, namely altered hemodynamics and filtration barrier dysfunction, proximal tubule transport and injury are also involved in the initiation and progression of kidney disease [19]. SGLT2 transporters reabsorb over 90% of filtered glucose and are elevated in the diabetic proximal tubule, contributing to hyperglycemia [20]. SGLT2 is now considered a key target for anti-hyperglycemic therapy [21]. In fact, Jurczak, [22] examined the effects of SGLT2 gene (SLC5A2) deletion on db/db mouse pancreas and other organs, and metabolic and renal outcomes were improved, but the transport properties of the diabetic nephron were not studied. The major novel finding of our study is that the collecting duct compensates for diuresis in response to EMPA, by increasing water reabsorption in the terminal IMCD. PGE2 is implicated in this response, since the attenuation of AVP-mediated water reabsorption was significantly reduced in db/db mice treated with EMPA compared to the non-diabetic mice.
Following SGLT2 inhibition, the tubules in the distal nephron will be exposed to increased solute and water delivery. To prevent excessive water losses, the CD must adapt and increase water reabsorption. We recently reported a key role for PGE2/EP1 in attenuating mouse CD AVP-mediated water transport [15]. Our data suggest that reductions in EP1-mediated attenuation of AVP transport may underlie the reductions we observed. Another possibility is increased AVP-independent water reabsorption by the CD. Gao, et al. [24] reported a major role for CD PGE2/EP4 in AVP-independent water reabsorption. In our mice, following 6 wks of EMPA, volume status is maintained despite reduced proximal tubule reabsorption, suggesting that compensation occurs downstream of the proximal tubule. It is quite possible that a combination of the above-mentioned mechanisms occurs to ensure optimal compensation.
SGLT2 inhibitors reduce glomerular hyperfiltration in human DKD and reduce proteinuria [2,3]. While hyperfiltration may be attenuated in diabetic patients, GFR ultimately normalizes, which is promising in terms of therapeutic usefulness of these drugs for CKD patients already at risk for reduced renal filtration function [2,23]. In our study, db/db mice were hyperfiltering, but EMPA had no effect on GFR. However, we did observe a significant decrease in proteinuria concomitant with reductions in hyperglycemia, but independent of changes in GFR. The mechanisms underlying the reduced proteinuria were not explored and warrant further investigation. The most recent work in rodents highlights the positive renal outcomes associated with SGLT2 inhibition in type 2 diabetes, up to 16 wks treatment [1,25,26]. Renal benefits were not observed following SGLT2 inhibition with canagliflozin in type 1 diabetic eNOS knockout mice [28], however in type 1 Akita mice hyperfiltration and albuminuria were both improved by EMPA [29]. However, the beneficial outcomes are inconsistent even in type 2 diabetic db/db mice. For example, in a study by Gallo, et al. [27], molecular markers of renal fibrosis were ameliorated in db/db mice following 10 wks of EMPA, without reductions in albuminuria or protection against kidney injury. Perhaps following longer treatment, improvement in renal hyperfiltration is more likely in our study, but we observed significant amelioration of albuminuria without changes in GFR. The reason for the discrepancy in all these rodent studies is unclear, but drug class, timing, and dose may be important factors, and in previous reports EMPA treatment was prolonged up to 16 wks. More work is needed to fully understand the mechanisms underlying the benefits of EMPA, since in our study they are clearly not associated with improvements in hyperglycemia or hyperfiltration.
Overall, PGE2 promotes diuresis and natriuresis, acting on EP1 and EP3, and stimulates water reabsorption via EP4. All three subtypes have been localized to the proximal tubule, TAL, and CD by our group, and their expression compared in normotensive and hypertensive mice [15]. Here we show the pattern of expression of EP receptors in the db/db mouse kidney and its heterozygous control. To the best of our knowledge, this is the first characterization of renal EP receptor expression in type 2 diabetes. The most noteworthy findings of this study are that renal EP1 and EP3 are mostly increased in type 2, as they are in type 1 diabetes [6,8], and EP4 is diminished. The increase in mRNA may occur as a feedback response to lower EP receptor protein expression. The expression profile depends on the nephron segment, and as in our previous study we found that PT EP receptor expressions are diminished in diabetes. The significance of this decrease has yet to be studied. We previously reported that PGE2 plays a stimulatory role in PT water transport [30], but very little is known about other PT transport processes linked to each EP receptor subtype. Of interest, we also observed molecular changes in the expression of sodium transporters and aquaporins in EMPA treated mice, independent of the diabetic state, namely PT SGLT1, TAL NKCC2, and CD aquaporins 1 and 2. It is not clear whether the mRNA expression patterns result from feedback responses or are a result of compensatory responses to conserve sodium and water and prevent excessive losses.
Altogether our work emphasizes the need to fully investigate the transport responses of the nephron following proximal tubule SGLT2 inhibition, especially since these inhibitors have become a central part of the treatment arsenal to reduce hyperglycemia and prevent cardiovascular and renal complications associated with type 2 diabetes. It is not surprising that the PGE2/EP receptor system is responsive to EMPA treatment to prevent excessive water losses. After all it has long been recognized that both PGE2 and AVP are key hormones in the fine-tuning of water balance, especially in diabetes, but even more so when the nephron is further challenged with increased solute and water delivery. The long-term consequences of EMPA treatment on distal nephron transport warrant further investigation.
Data availability
The data used to support the findings of this study are included within the article.
Financial support
This study was supported by a grant from Kidney Foundation of Canada (grant#152092).
Author contributions
RN wrote the initial manuscript. RN, JZ, VC and JFT performed experimental procedures. JFT, KDB and RLH revised the manuscript.
- Rastogi A, Bhansali A. SGLT2 Inhibitors through the Windows of EMPA-REG and CANVAS Trials: A Review. Diabetes Ther. 2017; 8: 1245–1251. PubMed: https://pubmed.ncbi.nlm.nih.gov/29076040/
- Wanner C, Inzucchi SE, Lachin JM, Fitchett D, von Eynatten M, et al. Empagliflozin and Progression of Kidney Disease in Type 2 Diabetes. N Engl J Med. 2016; 375: 323-334.
- Heerspink HJL, Perkins BA, Fitchett DH, Husain M, Cherney DZI. Sodium Glucose Cotransporter 2 Inhibitors in the Treatment of Diabetes: Cardiovascular and Kidney Effects, Potential Mechanisms and Clinical Applications. Circulation 2016; 134: 752-772. PubMed: https://pubmed.ncbi.nlm.nih.gov/27470878/
- Cherney DZI, Perkins BA, Soleymanlou N, Maione M, Lai V, et al. Renal Hemodynamic Effect of Sodium-Glucose Cotransporter 2 Inhibition in Patients with Type 1 Diabetes Mellitus. Circulation. 2014; 129: 587-597. PubMed: https://pubmed.ncbi.nlm.nih.gov/24334175/
- Nasrallah R, Clark J, Hébert RL. Prostaglandins in the kidney: developments since Y2K. Clin Sci (Lond). Review. 2007; 113: 297-311. PubMed: https://pubmed.ncbi.nlm.nih.gov/17760567/
- Nasrallah R, Hassouneh R, Hébert RL. Chronic kidney disease: targeting prostaglandin E2 receptors. Am J Physiol. 307: 2014; F243-250. PubMed: https://pubmed.ncbi.nlm.nih.gov/24966087/
- Nasrallah R, Hassouneh R, Hébert RL. Prostaglandin E2, kidney disease, and cardiovascular risk: beyond hypertension and diabetes. J Am Soc Nephrol. 2016; 27: 666–676. PubMed: https://pubmed.ncbi.nlm.nih.gov/26319242/
- Nasrallah R, Xiong H, Hébert RL. Renal prostaglandin E2 receptor (EP) expression profile is altered in streptozotocin and B6-Ins2Akita type 1 diabetic mice. Am J Physiol. 2007; 292: 278–284. PubMed: https://pubmed.ncbi.nlm.nih.gov/16954344/
- Nasrallah R, Robertson SJ, Hébert RL. Chronic COX inhibition reduces diabetes-induced hyperfiltration, proteinuria, and renal pathological markers in 36-week B6-Ins2(Akita) mice. Am J Nephrol. 2009; 30: 346-353. PubMed: https://pubmed.ncbi.nlm.nih.gov/19609076/
- Nasrallah R, Robertson SJ, Karsh J, Hébert RL. Celecoxib modifies glomerular basement membrane, mesangial area and podocyte structure in OVE26 mice, but ibuprofen is more detrimental. Clin Sci. 2013; 124: 685-694. PubMed: https://pubmed.ncbi.nlm.nih.gov/23305077/
- Cherney DZI, Miller J, Scholey JW, Bradley TJ, Slorach C, et al. The effect of cyclooxygenase 2 inhibition on renal hemodynamic function in humans with type 1 diabetes mellitus. Diabetes 2008; 57: 688-695. PubMed: https://pubmed.ncbi.nlm.nih.gov/18083781/
- Thibodeau JF, Nasrallah R, Hébert RL, Kennedy C. Reduced albuminuria in diabetic PTGER1-null mice. Am J Pathol. 2013; 183: 1789-1802.
- Hassouneh R, Nasrallah R, Zimpelmann J, Gustol A, Ghossein J, et al. ProstaglandinE2/EP3 inhibits water reabsorption and contributes to polyuria and kidney injury in streptozotocin diabetic mice. Diabetologia. 2016; 59: 1318-1328. PubMed: https://pubmed.ncbi.nlm.nih.gov/26995650/
- Fu Y, Breljak D, Onishi A, Batz F, Patel R, et al. Organic anion transporter OAT3 enhances the glucosuric effect of the SGLT2 inhibitor empagliflozin. Am J Physiol. 2018; 315: F386-F394. PubMed: https://pubmed.ncbi.nlm.nih.gov/29412698/
- Nasrallah R, Zimpelmann J, Eckert D, Ghossein J, Geddes S, et al. Prostaglandin E2 EP1 receptor inhibits vasopressin-dependent water reabsorption and sodium transport in mouse collecting duct. Lab Invest. 2018; 98: 360-370.
- Nadler SP, Zimpelmann JA, Hébert RL. Prostaglandin E2 inhibits water permeability at a post-cAMP site in rat terminal inner medullary collecting duct. Am J Physiol. 1992; 262: F229-235. PubMed: https://pubmed.ncbi.nlm.nih.gov/1311524/
- Hébert RL, Jacobson HR, Breyer MD. Prostaglandin E2 inhibits sodium transport in the rabbit CCD by raising intracellular calcium. J. Clin. Invest. 1991; 87: 1992-1998. PubMed: https://pubmed.ncbi.nlm.nih.gov/1645747/
- Guan YY, Zhang RM. Breyer B, Fowler L, Davis RL, et al. Prostaglandin E2 inhibits renal collecting duct Na+ absorption by activating the EP1 receptor. J Clin Invest. 1998; 102: 194–201. PubMed: https://pubmed.ncbi.nlm.nih.gov/9649573/
- Zeni L, Norden AGW, Cancarini G, Unwin RJ. A more tubulocentric view of diabetic kidney disease. J Nephrol. 2017; 30: 701-717. PubMed: https://pubmed.ncbi.nlm.nih.gov/28840540/
- Vallon V, Platt KA, Cunard R, Schroth J, Whaley J, et al. SGLT2 mediates glucose reabsorption in the early proximal tubule. J Am Soc Nephrol. 2011; 22: 104-112. PubMed: https://pubmed.ncbi.nlm.nih.gov/20616166/
- Wang XX, Levi J, Luo Y, Myakala K, Herman-Edelstein M, et al. SGLT2 Expression is increased in Human Diabetic Nephropathy: SGLT2 Inhibition Decreases Renal Lipid Accumulation, Inflammation and the Development of Nephropathy in Diabetic Mice. J Biol Chem. 2017; 292: 5335–5348. PubMed: https://pubmed.ncbi.nlm.nih.gov/28196866/
- Jurczak MJ, Lee HY, Birkenfeld AL, Jornayvaz FR, Frederick DW, et al. SGLT2 Deletion Improves Glucose Homeostasis and Preserves Pancreatic b-Cell Function. Diabetes 2011; 60: 890–898. PubMed: https://pubmed.ncbi.nlm.nih.gov/21357472/
- Barnett AH, Mithal A, Manassie J, et al. Efficacy and safety of empagliflozin added to existing antidiabetes treatment in patients with type 2 diabetes and chronic kidney disease: a randomised, double-blind, placebo-controlled trial. Lancet Diabetes Endocrinol. 2014; 2: 369-384. PubMed: https://pubmed.ncbi.nlm.nih.gov/24795251/
- Gao M, Cao R, Du S, et al. Disruption of prostaglandin E2 receptor EP4 impairs urinary concentration via decreasing aquaporin 2 in renal collecting ducts. Proc Natl Aca Sci. 2015; 112: 8397-8402.
- Wang XX, Levi J, Luo Y, Myakala K, Herman-Edelstein M, et al. SGLT2 Expression is increased in Human Diabetic Nephropathy: SGLT2 Inhibition Decreases Renal Lipid Accumulation, Inflammation and the Development of Nephropathy in Diabetic Mice. J Biol Chem. 2017; 292: 5335–5348. PubMed: https://pubmed.ncbi.nlm.nih.gov/28196866/
- Terami N, Ogawa D, Tachibana H, Hatanaka T, Wada J, et al. Long-Term Treatment with the Sodium Glucose Cotransporter 2 Inhibitor, Dapagliflozin, Ameliorates Glucose Homeostasis and Diabetic Nephropathy in db/db Mice. PLoS ONE. 2014; 9: e100777. PubMed: https://pubmed.ncbi.nlm.nih.gov/24960177/
- Gallo LA, Ward MS, Fotheringham AK, Zhuang A, Borg DJ, et al. Once daily administration of the SGLT2 inhibitor, empagliflozin, attenuates markers of renal fibrosis without improving albuminuria in diabetic db/db mice. Sci Rep. 2016; 6: 26428. PubMed: https://pubmed.ncbi.nlm.nih.gov/27226136/
- Gangadharan KM, Gross S, Mudaliar H, Huang C, Pegg K, et al. Inhibition of kidney proximal tubular glucose reabsorption does not prevent against diabetic nephropathy in type 1 diabetic eNOS knockout mice. PLoS One. 2014; 9: e108994. PubMed: https://pubmed.ncbi.nlm.nih.gov/25369239/
- Vallon V, Gerasimova M, Rose MA, Masuda T, Satriano J, et al. SGLT2 inhibitor empagliflozin reduces renal growth and albuminuria in proportion to hyperglycemia and prevents glomerular hyperfiltration in diabetic Akita mice. Am J Physiol Renal Physiol. 2014; 306: F194–F204. PubMed: https://pubmed.ncbi.nlm.nih.gov/24226524/
- Nasrallah R, Hassouneh R, Zimpelmann J, Karam AJ, Thibodeau JF, et al. Prostaglandin E2 increases proximal tubule fluid reabsorption and modulates cultured proximal tubule cell responses via EP1 and EP4 receptors. Lab Invest. 2015; 95: 1044-1055. PubMed: https://pubmed.ncbi.nlm.nih.gov/26121313/