
More Information
Submitted: 14 July 2020 | Approved: 27 July 2020 | Published: 28 July 2020
How to cite this article: Shawky SM, Khalifa MMM, Amin KM, Hassan MS. Correlation between interdialytic weight gain, left ventricular hypertrophy and FGF- 23 in prevalent hemodialysis patients. J Clini Nephrol. 2020; 4: 036-043.
DOI: 10.29328/journal.jcn.1001057
ORCiD: orcid.org/0000-0002-1456-0098
Copyright License: © 2020 Shawky SM, et al. This is an open access article distributed under the Creative Commons Attribution License, which permits unrestricted use, distribution, and reproduction in any medium, provided the original work is properly cited.
Keywords: Interdialytic weight gain, End stage renal disease, Fibroblast growth factor 23
Abbreviations: CKD: Chronic Kidney Disease; CHF: Congestive Heart Failure; EDD: End Diastolic Diameter; EDV: End Diastolic Volume; EF BIP: Ejection Fraction Biplane; ESD: End Systolic Diameter; ESRD: End Stage Renal Disease; ESV: End Systolic Volume; FGF-23: Fibroblast Growth Factor-23; HB; Hemoglobin; HD: Hemodialysis; IDWG: Interdialytic Weight Gain; IVC: Inferior Vena Cava Diameter; LAD: Left Atrial Diameter; LV: Left Ventricle; LVMI: Left Ventricular Mass Index; 2D: Two-Dimensional LAD: Left Atrial Diameter

Correlation between interdialytic weight gain, left ventricular hypertrophy and FGF- 23 in prevalent hemodialysis patients
Sahar Mahmoud Shawky1, Maha Mohamed Mohamed Khalifa2*, Kholoud Mahmoud Amin3 and Mohamed Saeed Hassan4
1Professor of Nephrology, Department of Internal Medicine and Nephrology, Faculty of Medicine, Ain Shams University, Egypt
2Lecturer of Cardiology, Department of Cardiology, Faculty of Medicine, Ain Shams University, Egypt
3Resident of Internal Medicine and Nephrology, Department of Internal Medicine and Nephrology, Faculty of Medicine, Ain Shams University, Egypt
4Lecturer of Nephrology and Internal Medicine, Department of Internal Medicine and Nephrology, Faculty of Medicine, Ain Shams University, Egypt
*Address for Correspondence: Maha Mohamed Mohamed Khalifa, Lecturer of Cardiology, Department of Cardiology, Faculty of Medicine, Ain Shams University, 11312 Cairo, Egypt, Email: [email protected]
Background:Patients with end-stage renal disease are suspected to have significant volume shifts and thereby cardiovascular strain as a result to interdialytic weight gain, chronic fluid overload and fluid removal during dialysis. In long-term hemodialysis patients, higher IDWG (interdialytic weight gain) could be associated with poor survival. Patients with the lowest interdialytic weight gain have the greatest survival. Certain laboratory and imaging modalities could help to assess and monitor the appropriate fluid balance for hemodialysis patients.
FGF -23 might be associated with cardiovascular morbidity in ESRD patients.
Objective: To evaluate correlation between hypervolemia and left ventricular hypertrophy and FGF-23 in hemodialysis patients.
Patients and Methods: This cross sectional study was conducted on 60 prevalent hemodialysis patients. Patients were divided into two groups according to interdialytic weight gain (IDWG): Group I (low IDWG): Patients with absolute weight gain < 3 kg. Group II (high IDWG): patients with weight gain ≥ 3 kg. FGF 23, routine laboratory tests and echocardiography were done for both groups.
Results: high IDWG group has higher systolic blood pressure and LVMI than low IDWG group. In all patients group, FGF-23 had a positive correlation with (weight gain, Na, PO4, PTH, systolic, diastolic blood pressure, LV wall septal and posterior wall thickness and left ventricular mass index) and had a negative correlation with Hb level.
Conclusion: FGF-23 could be a marker of volume overload and LVH in ESRD patients, which affect morbidity and mortality in these patients.
FGF- 23 might be a marker of anemia in ESRD as it has a negative correlation with HB.
Despite improvements in dialysis treatment, patients on maintenance hemodialysis (HD) have a higher mortality rate than the general population [1]. Cardiovascular disease is the leading cause of morbidity and mortality in patient with ESRD, accounting for more than 50% of all deaths [2].
Patients with end-stage renal disease are exposed to significant volume overload which can lead to myocardial strain [3]. Fluid overload in hemodialysis patients is still to be considered a challenge in its treatment and may require emergent dialysis. A combination treatment of limiting salt and fluid intake and ultrafiltration during dialysis can be used to help those oliguric or anuric patients who have tendency to accumulate fluid. Patients are associated with adverse outcomes including hypertension, exacerbation of congestive heart failure (CHF), and increased risk of death [4].
In long-term hemodialysis patients, higher IDWG (interdialytic weight gain) is Known to be associated with poor survival and increased cardiovascular death, however patients with the lowest interdialytic fluid retention have higher survival rate [4]. Patients with IDWG ≥ 5.7% of dry weight were found to have a higher mortality risk. Moreover, Kalantar-Zadeh, et al. revealed that the risks of all-cause and cardiovascular mortality were significantly higher in long-term HD patients with IDWG ≥ 4.0 kg [4]. Kim, et al. found that interdialytic weight gain (IDWG) more than > 3.0 kg was associated with a 1.29-fold increase in all-cause mortality, independent of dialysis session length [5].
LVH is a cardiovascular complication among renal patients. Pathophysiologic factors involved in LVH of CKD and ESRD patients have generally been related to either afterload, preload or other factors. all these factors result in thickening of the myocardial cell which lead to concentric LV remodeling and activation of the intracardiac renin-angiotensin system [6]. Activation of xanthine oxidase as well as the phosphodiesterase-5 pathway may also be involved in the development of LVH [6].
Fibroblast growth factor-23 is an osteocyte-derived phosphaturic hormone which helps in inhibition of production of 1, 25 (OH)2 vitamin D through reduction of the activity of renal 1α-hydroxylase which lead to hyperparathyrodism. In patients with chronic kidney disease, FGF-23 levels rise in response to a decrease in its filtration and/or degradation by the diseased kidney and to compensate for persistent phosphate retention [7]. Interdialytic volume load might be associated with increased LVMI and FGF-23 level [8].
Aim of the work
To evaluate correlation between hypervolemia, left ventricular hypertrophy and FGF-23 in hemodialysis patients.
This cross sectional study was conducted in Ain shams university hospital, on 60 prevalent hemodialysis patients in year 2019.
Patients were divided into two groups according to interdialytic weight gain (IDWG):
Group I (low IDWG): Patients with absolute weight gain < 3 kg [5].
Group II (high IDWG): patients with weight gain ≥ 3 kg [5].
The study was approved by the Ethical committee with informed consent was taken from each participant. Three patients died during different stages of data collection, all of them were from the High IDWG group.
Inclusion criteria
Malignancy. Severe Infection. Patients had cardiac attack in last three months. Decompensated liver disease, PTH more than 800 pg/ml, corrected Ca2+ level more than 10.5 mg/ dl and po4 level more than 7.7 mg/dl.
All patients were subjected to: History taking including etiology of ESRD, duration of HD. Clinical examination: including assessment of dry weight, volume status, average reading of interdialytic weight gain, chest examinations and lower limb edema. Dry weight is the lowest post-dialytic weight that the patient can tolerate without intra-dialytic symptoms as cramps and hypotension in the absence of fluid overload while achieve a near normal arterial pressure [9].
Laboratory investigations included: Serum Creatinine, Blood Urea, Na+, K+, Serum albumin, Ca2+, (PO4)3-, PTH, CBC, Iron profile, lipid profile and intact FGF -23 which was measured in serum using double-antibody sandwich ELISA kit (Bioassay Technology Laboratory®, SHANGHAI KORAIN BIOTECH CO, LTD.) that has sensitivity with lower detection limit of 2.49 pg/ml, wide analytical range from 5 pg/ml – 1500 pg/ml and Intra-Assay precision with CV < 10% , Inter-Assay: CV < 12%.
Samples with concentration above 1500 pg/ml, were re-assayed after 1:10 dilution of the serum.
Samples were collected before mid-week dialysis session.
Echocardiography
It was done to all patients before mid-week session. Two-dimensional (2D) and M Mode Images were obtained in the standard views (parasternal and apical views) and included the following measurements: Ejection fraction Biplane (EF BIP) Simpson. LV wall Thickness in diastole. Left ventricular (LV) dimensions and volumes: End Systolic Diameter (ESD). End Systolic volume (ESV). End Diastolic Diameter (EDD) and End Diastolic volume (EDV). Left atrial diameter (LAD). Inferior vena cava diameter (IVC). With estimation of Left ventricular mass index (LVMI).
LV mass (Penn) = 1.04 ([LVIDD + PWTD + IVSTD]3 - [LVIDD]3) -13,6 g.
LVIDD = Left Ventricular Internal Diameter in Diastole.
PWTD = Posterior Wall Thickness in Diastole.
IVSTD = Interventricular Septum Thickness in Diastole.
Statistical analysis
Data were collected, revised, coded and entered to the Statistical Package for Social Science version 23. The quantitative data were presented as mean, standard deviations and ranges if the data were parametric and median, inter quartile range (IQR) if it was non-parametric. Also qualitative variables were presented as number and percentages. We compared qualitative data by using Chi-square test and/or Fisher exact test when the expected count in any cell found less than 5. As regards the quantitative data and parametric distribution, we compared between groups by using Independent t-test while we used Mann-Whitney test in comparison of the non-parametric distribution. Spearman correlation coefficients were used to assess the correlation between two quantitative parameters in the same group.
p - value was considered significant as the following:
p - value > 0.05: Non significant (NS). p - value < 0.05: Significant (S). p - value < 0.01: Highly significant (HS).
This cross sectional study was done on 60 prevalent hemodialysis patients in year 2019. Patients were divided into two groups according to interdialytic weight gain (IDWG): Group I (low IDWG): The number of patients with weight gain < 3 kg (32 pateints).
Group II ((high IDWG): The number of patients with absolute weight gain ≥ 3 kg (28 patints).
Three patients died during different stages of data collection, all of them were from the high IDWG group. Study was completed on 57 patients after exclusion of the three patients from the high IDWG group.
Low IDWG ➝ 32 patients. High IDWG ➝ 25 patients.
There was no significant difference between Low IDWG group and High IDWG group as regards demographic data. HTN is the main cause of ESRD among the two groups (Table 1).
| Table 1: Comparison between Low IDWG group and High IDWG group as regards demographic data. | ||||
| Low IDWG | High IDWG | p - value | ||
| No. = 32 | No. = 25 | |||
| Age (y) | Median (IQR) | 52 (42.5 – 59.5) | 49 (35 – 54) | 0.234‡ |
| Sex | Female | 17 (53.1%) | 10 (40.0%) | 0.325* |
| Male | 15 (46.9%) | 15 (60.0%) | ||
| Etiology of ESRD | DM | 3 (9.4%) | 2 (8.0%) | 0.928* |
| HTN | 17 (53.1%) | 12 (48.0%) | ||
| P.cystic kidney | 2 (6.3%) | 2 (8.0%) | ||
| Obstructive uropathy | 3 (9.4%) | 1 (4.0%) | ||
| Analgesic nephropathy | 3 (9.4%) | 4 (16.0%) | ||
| Chronic G.N Idiopathic |
2 (6.3%) 2 (6.3%) |
1 (4.0%) 3 (12.0%) |
||
| Duration of hemodialysis (months) |
Median (IQR) | 93 (60 – 150) | 108 (78 – 144) | 0.439‡ |
| HCV Ab | Negative | 17 (53.1%) | 15 (60.0%) | 0.604* |
| Positive | 15 (46.9%) | 10 (40.0%) | ||
| *: Chi-square test; ‡: Mann Whitney test | ||||
Systolic blood pressure was significantly higher in high IDWG group than low IDWG group (Table 2).
| Table 2: Comparison between Low IDWG group and High IDWG group as regards clinical findings. | ||||
| Low IDWG | High IDWG | p - value | ||
| No. = 32 | No. = 25 | |||
| Dry Weight (kg) | Mean ± SD | 70.41 ± 15.83 | 65.42 ± 17.54 | 0.265• |
| Interdialytic Weight Gain (kg) | Median (IQR) | 2 (2 – 2.25) | 3 (3 – 4) | 0.000‡ |
| Vascular Axis | AVF | 30 (93.8%) | 23 (92.0% | 0.248* |
| Perminant catheter | 2 (6.3%) | 0 (0.0%) | ||
| Temporary catheter | 0 (0.0%) | 1 (4.0%) | ||
| AVG | 0 (0.0%) | 1 (4.0%) | ||
| Chest examination | Clear | 27 (84.4%) | 9 (36.0%) | 0.002* |
| wheezy chest | 3 (9.4%) | 7 (28.0%) | ||
| Diminished air entry | 2 (6.3%) | 5 (20.0%) | ||
| Crepitation | 0 (0.0%) | 4 (16.0%) | ||
| L.L eodema | No | 21 (65.6%) | 1 (4.0%) | 0.000* |
| Mild | 9 (28.1%) | 16 (64.0%) | ||
| Moderate | 2 (6.3%) | 6 (24.0%) | ||
| Severe | 0 (0.0%) | 2 (8.0%) | ||
| Systolic blood pressure (mmHg) |
Median (IQR) | 120 (115 – 130) | 140 (120 – 150) | 0.016‡ |
| Diastolic blood pressure (mmHg) |
Median (IQR) | 80 (70 – 90) | 80 (80 – 90) | 0.425‡ |
| Mean arterial blood pressure (mmHg) | Mean ± SD | 94.38 ± 12.88 | 100.53 ± 12.53 | 0.076• |
| *: Chi-square test; •: Independent t-test; ‡: Mann Whitney test. | ||||
Posterior wall thickness measured by Echocardiography (PW), Left atrial diameter (LA) and Left ventricular mass index (LVMI) were all significantly higher in high IDWG group than low IDWG group (Table 3).
| Table 3: Comparison between Low IDWG group and High IDWG group as regards ECHO findings. | ||||
| Low IDWG | High IDWG | p - value | ||
| No. = 32 | No. = 25 | |||
| IVS (mm) | Median (IQR) | 10 (9 – 11.5) | 12 (10 – 12) | 0.221‡ |
| EDD (mm) | Mean ± SD | 50.75 ± 6.01 | 53.00 ± 3.96 | 0.112• |
| PW (mm) | Median (IQR) | 10 (9 – 11) | 11 (10 – 12) | 0.042‡ |
| EF BIP % | Median (IQR) | 60.5 (53 – 65) | 58 (55 – 62) | 0.579‡ |
| LA (mm) | Mean ± SD | 39.81 ± 4.62 | 42.72 ± 4.50 | 0.021• |
| IVC (mm) | Median (IQR) | 13.5 (9.5 – 18.5) | 15 (10 – 18) | 0.834‡ |
| LV mass index (gm/m2) |
Mean ± SD | 107.19 ± 29.70 | 133.40 ± 36.62 | 0.004• |
| Hypertrophy | Normal geometry | 12 (37.5%) | 4 (16.0%) | 0.127* |
| Eccentric hypertrophy | 10 (31.3%) | 10 (40.0%) | ||
| Concentric hypertrophy | 8 (25.0%) | 11 (44.0%) | ||
| Concentric remodeling | 2 (6.3%) | 0 (0.0%) | ||
| *: Chi-square test; •: Independent t-test; ‡: Mann Whitney test. | ||||
Serum creatinine and (PO4)3- were significantly higher in high IDWG group than in low IDWG group while the other laboratory findings showed no significant difference (Table 4).
| Table 4: Comparison between Low IDWG group and High IDWG group as regards Laboratory data | ||||
| Low IDWG | High IDWG | p - value | ||
| No. = 32 | No. = 25 | |||
| Blood urea 1 (mg/dl) | Median (IQR) | 131 (107.5 – 171) | 116 (101 – 141) | 0.101‡ |
| Blood urea 2 (mg/dl) | Median (IQR) | 42.5 (28 – 56.5) | 32 (23 – 49) | 0.234‡ |
| URR % | Median (IQR) | 0.71 (0.69 – 0.77) | 0.71 (0.66 – 0.76) | 0.853‡ |
| Serum Creatinine (mg/dl) | Median (IQR) | 7.95 (6.85 – 8.85) | 8.8 (7.5 – 10) | 0.028‡ |
| Serum Na+(mmol/L) | Median (IQR) | 138 (135 – 140) | 138 (137 – 140) | 0.254‡ |
| Serum K+(mmol/L) | Median (IQR) | 4.4 (4.1 – 4.95) | 4.9 (4.5 – 5.1) | 0.066‡ |
| Serum (PO4)3- (mg/dl) | Mean ± SD | 4.15 ± 1.01 | 4.92 ± 0.85 | 0.003• |
| PTH (pg/ml) | Median (IQR) | 275.5 (51 – 485.5) | 433 (139 – 540) | 0.141‡ |
| Serum Ca2+(mg/dl) | Mean ± SD | 8.28 ± 0.66 | 8.30 ± 0.94 | 0.927• |
| Serum Albumin (g/dl) | Mean ± SD | 3.65 ± 0.43 | 3.67 ± 0.21 | 0.816• |
| Corrected Ca2+ (mg/dl) | Mean ± SD | 8.560.69 | 8.57 ± 0.97 | 0.993• |
| HB (g/dl) | Mean ± SD | 10.02 ± 1.52 | 10.41 ± 1.38 | 0.322• |
| TIBC (µ/dl) | Median (IQR) | 197.5 (178.5 – 220) | 194 (169 – 227) | 0.904‡ |
| Serum Ferritin (µ/L) | Mean ± SD | 696.90 ± 472.31 | 997.08 ± 677.54 | 0.054• |
| Serum Iron (µ/dl) | Median (IQR) | 46.5 (38 – 70) | 59 (42 – 81) | 0.394‡ |
| Iron saturation % | Median (IQR) | 0.26 (0.19 – 0.37) | 0.3 (0.2 – 0.45) | 0.435‡ |
| Serum Cholesterol(mg/dl) | Mean ± SD | 130.94 ± 13.65 | 131.16 ± 13.93 | 0.952• |
| LDL (mg/dl) | Mean ± SD | 76.91 ± 12.73 | 79.63 ± 12.40 | 0.421• |
| HDL (mg/dl) | Mean ± SD | 33.34 ± 7.69 | 32.16 ± 8.03 | 0.574• |
| TG (mg/dl) | Median (IQR) | 93 (82.5 – 138) | 89 (69 – 117) | 0.372‡ |
| FGF-23 (pg/mL) | Median (IQR) | 290 (175 – 640) | 480 (230 – 850) | 0.098‡ |
| •: Independent t-test; ‡: Mann Whitney test. | ||||
As regards correlation of FGF-23 in all patients, we found FGF-23 was positively correlated with weight gain, systolic blood pressure, diastolic blood pressure, mean arterial blood pressure, IVS, PW, LA and LVMI while was negatively correlated with Hb (Table 5).
| Table 5: Correlation between FGF-23 and all parameters in all patients (n = 57): | ||
| FGF-23 | ||
| r | p - value | |
| Age(y) | -0.242 | 0.069 |
| Duration of dialysis (months) | -0.123 | 0.363 |
| Dry Weight (kg) | -0.232 | 0.083 |
| Interdialytic Weight Gain (kg) | 0.363** | 0.005 |
| Systolic blood pressure (mm/Hg) | 0.308* | 0.020 |
| Diastolic blood pressure (mm/Hg) | 0.294* | 0.026 |
| Mean arterial blood pressure (mm/Hg) | 0.333* | 0.011 |
| Blood urea 1 (mg/dl) | -0.087 | 0.518 |
| Blood urea 2 (mg/dl) | 0.029 | 0.832 |
| URR % | -0.175 | 0.193 |
| Serum Creatinine (mg/dl) | -0.027 | 0.840 |
| Serum Na+ (mmol/L) | 0.394** | 0.002 |
| Serum K+ (mmol/L) | 0.198 | 0.140 |
| Serum(PO4)3- (mg/dl) | 0.623** | 0.000 |
| PTH (pg/ml) | 0.680** | 0.000 |
| Serum Ca2+ (mg/dl) | -0.140 | 0.299 |
| Serum Albumin (g/dl) | -0.017 | 0.902 |
| Corrected Ca (mg/dl) | -0.079 | 0.561 |
| HB (g/dl) | -0.306* | 0.021 |
| TIBC (µ/dl) | 0.074 | 0.584 |
| Serum Ferritin (µ/L) | 0.169 | 0.209 |
| Serum Iron (µ/dl) | 0.039 | 0.771 |
| Iron saturation % | -0.024 | 0.858 |
| Serum Cholesterol(mg/dl) | 0.016 | 0.909 |
| LDL (mg/dl) | -0.087 | 0.518 |
| HDL (mg/dl) | 0.029 | 0.829 |
| TG (mg/dl) | 0.048 | 0.721 |
| IVS (mm) | 0.378** | 0.004 |
| EDD (mm) | 0.217 | 0.104 |
| PW (mm) | 0.314* | 0.017 |
| EF BIP % | -0.059 | 0.662 |
| LA (mm) | 0.287* | 0.031 |
| IVC (mm) | -0.047 | 0.730 |
| LV mass index (gm/m2) | 0.445** | 0.001 |
A regression analysis was done to study the effect of various factors on the FGF-23.PTH was the only independent factor that showed a signification effect on the level of the FGF-23 in our patients (Table 6).
| Table 6: Regression analysis between FGF-23 and all parameters in all patients (n = 57): | |||||
| Unstandardized Coefficients |
Standardized Coefficients |
t | Sig. | ||
| B | SE | Beta | |||
| (Constant) | -2524.197 | 2201.786 | -1.146 | 0.258 | |
| WGkg | 26.765 | 59.124 | 0.065 | 0.453 | 0.653 |
| SBP | -1.220 | 3.972 | -0.059 | -0.307 | 0.760 |
| DBP | 1.772 | 5.707 | 0.050 | 0.310 | 0.758 |
| Na | 17.669 | 17.233 | 0.135 | 1.025 | 0.311 |
| PO4 | 110.326 | 58.656 | 0.280 | 1.881 | 0.067 |
| PTH | 0.731 | 0.187 | 0.476 | 3.901 | 0.000 |
| HB | -4.000 | 32.031 | -0.015 | -0.125 | 0.901 |
| IVS | -12.670 | 41.920 | -0.059 | -0.302 | 0.764 |
| PW | -22.199 | 53.843 | -0.085 | -0.412 | 0.682 |
| LA | 1.441 | 11.787 | 0.017 | 0.122 | 0.903 |
| LVmass | -0.677 | 1.977 | -0.096 | -0.343 | 0.733 |
| LVmassindex | 2.571 | 2.447 | 0.226 | 1.051 | 0.299 |
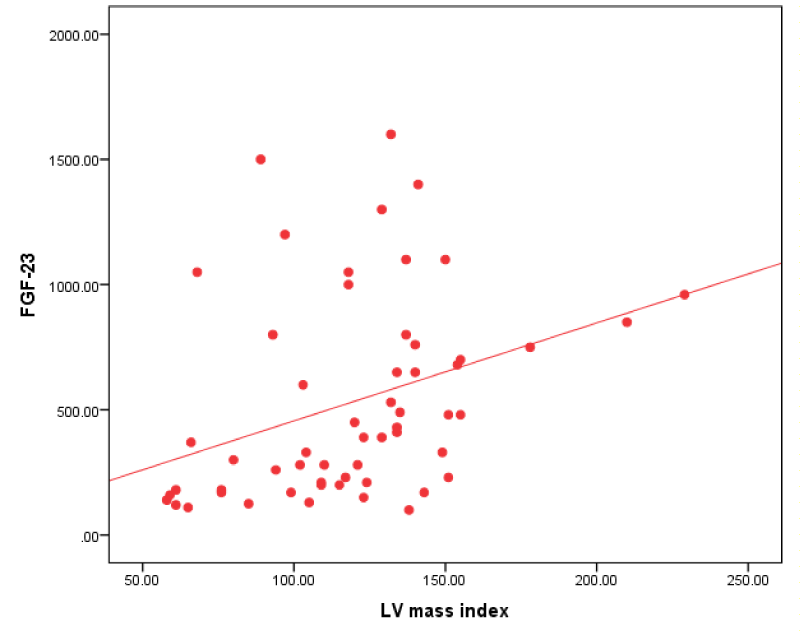
Figure 1: Correlation between FGF-23 and LV mass index in all patients.
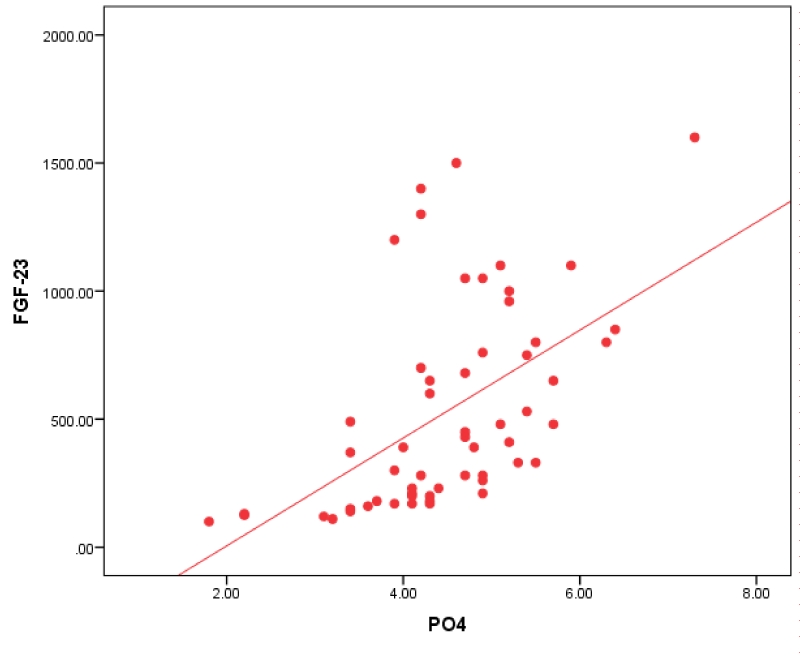
Figure 2: Correlation between FGF-23 and po4 in all patients.
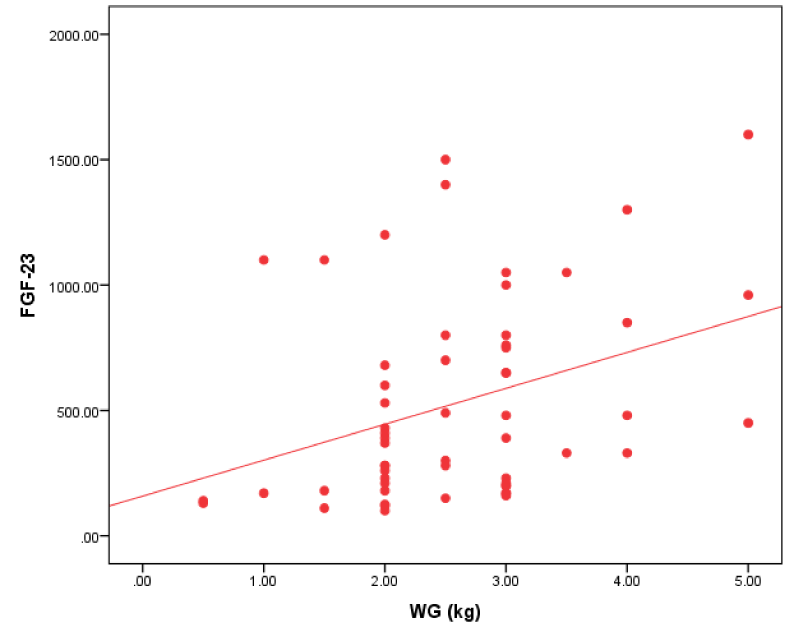
Figure 3: Correlation between FGF-23 and IDWG in all patients.
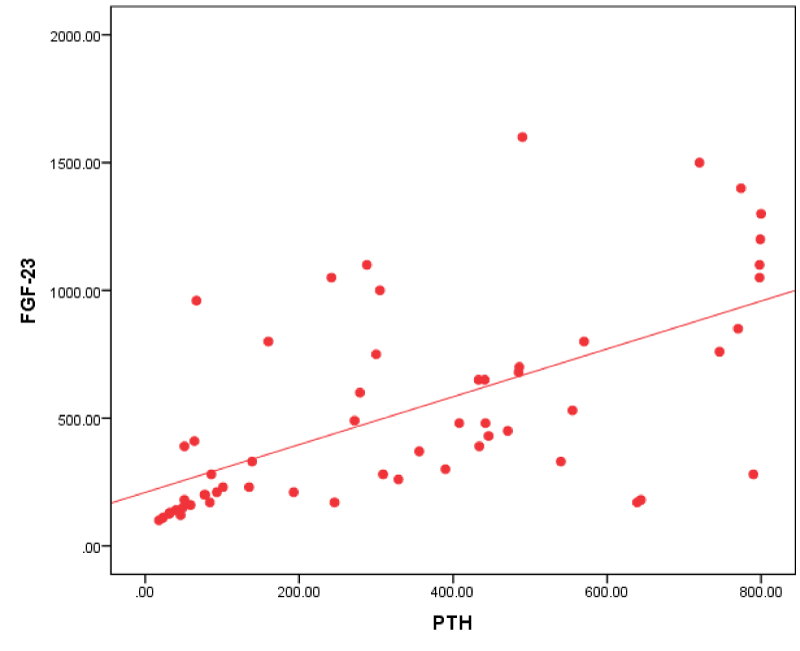
Figure 4: Correlation between FGF-23 and PTH in all patients.
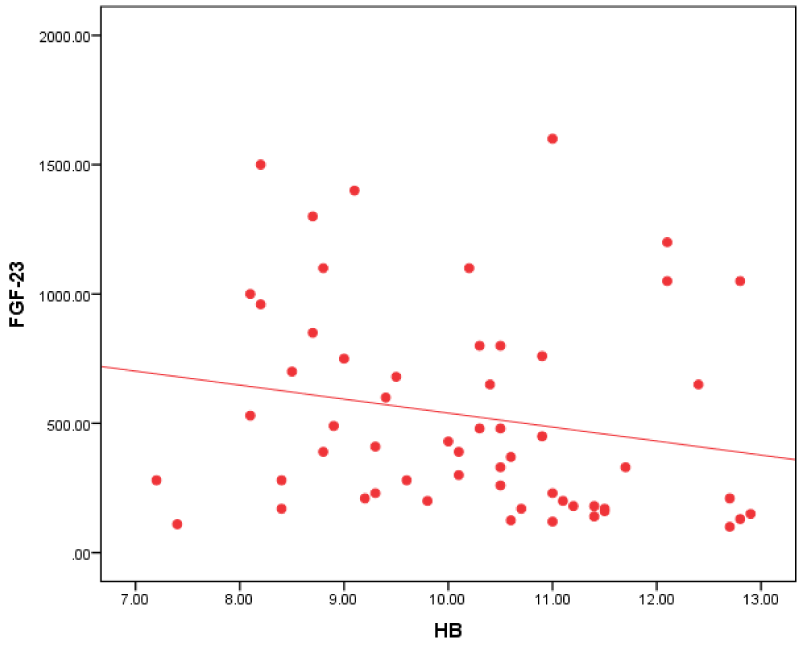
Figure 5: Correlation between FGF-23 and HB in all patients.
End-stage renal disease is increasing worldwide. This condition is particularly serious in developing countries where health resources are inadequate [10].
High interdialytic weight gain (IDGW) is thought leads to distorted hemodynamic conditions, and most probably higher cardiovascular morbidity [3].
It has been known that patients with kidney failure are predisposed to cardiovascular disease that manifests clinically in various forms, including coronary artery disease, atrial or ventricular arrhythmias, myocardial infarction, stroke, or congestive heart failure [3].
FGF-23 is a 32-kD bone-derived hormone with several endocrine functions in the kidney, it act in the presence of FGF receptor 1 (FGFR1) and its co receptor klotho promoting urinary phosphate excretion and the inhibition of the hydroxylation of 25-hydroxyvitamin D, to reduce the production of the active 1,25-dihydroxy vitamin D [11].
FGF-23 may be the first marker of disrupted bone metabolism in CKD patients and play major role in progression of Chronic Kidney Disease - Mineral and Bone Disorder (CKD-MBD) [12].
In our study we divided the patients into two groups:
Group I (low IDWG): The number of patients with weight gain < 3 kg (32 patients).
Group II ((high IDWG): The number of patients with absolute weight gain ≥ 3 kg (25 patents). In this group three patients died during the study so they were excluded.
In our study we found that HTN was the main cause of ESRD among the two groups patients low and high IDWG groups.
Our results were in agreement with Afify, et al. [13]. and Ghonemy, et al. [10]. Who found that Hypertension and DM were the main causes of ESRD in Egypt.
While we didn’t find a significant difference between low IDWG and high IDWG regarding to age, sex, etiology of ESRD duration of dialysis, dry weight.
In our study, there was no significant difference in Diastolic blood pressure and mean arterial blood pressure between low IDWG group and high IDWG group.
While we found that high IDWG group had significantly higher systolic blood pressure than low IDWG group, this was in agreement with Lee, et al. [5], they demonstrated a positive correlation between IDWG and pre dialysis Systolic blood pressure in their study on incident HD patients
We find that LVMI was significantly higher in high IDWG group than low IDWG group, this is in agreement with Mominadam, et al. [14] who found that systolic BP and IDWG were independent determinant of LVH development While Kahraman, et al. [15] didn’t find significant difference. between high IDWG group and low IDWG group as regards LVH and this was against our study.
In our study there was no significant difference between in FGF-23 level low IDWG group and high IDWG group.
We found that in high IDWG group there were a significant higher PW, LA and LVMI than low IDWG group but there was no significant difference as regard to IVS, IVC and LV EF measured by Simpson method.
During period of our study three patient from the high IDWG group died by myocardial infarction and cardiovascular stroke. The three patients had ischemic heart disease.
These results were in agreement with Cabrera, et al. [16]. Who revealed that the higher absolute IDWG was associated with a greater risk of hospitalization for heart failure, volume overload and major adverse cardiac events.
Brown, et al. [17], found that HD patients had high incidence of cardiac morbidity and mortality and echocardiographic evidence of hemodialysis-related myocardial stunning supports a potential link between the hemodialysis treatment and cardiac squeal.
As regards FGF-23 correlations in all patients group:
We found that FGF-23 had a positive correlation with interdialytic weight gain.
Our study result agreed with Humalda, et al. [18] who revealed that FGF-23 correlated with UF volume and biochemical markers of volume overload. This was against Minoo, et al. [19], who revealed that there was no significant relationship between FGF-23 levels and volume overload.
Our study revealed that FGF-23 had a positive correlation with systolic blood pressure, diastolic blood pressure, mean arterial blood pressure in all patients group.
This agreed with Li, et al. [20] who revealed that mean arterial blood pressure increases in long standing ESRD patients and it was significantly correlated with FGF-23.
Our study revealed that FGF-23 in all patients group had a positive correlation IVS, PW, LA and LVMI.
This result was in agreement with Uvner, et al. [8] in their study on 97 HD patients, they found that increased FGF-23 concentrations were associated with increased LVMI and increased prevalence of LVH.
Rebholz, et al. [11] found that FGF-23 is a risk factor for cardiovascular disease as well as all-cause mortality, and that these associations may be stronger among persons with CKD.
In our study of all patients group; FGF-23 had a positive correlation with Na+, (PO4)3- and PTH; as regards (PO4)3- this agreed with Unsal, et al. [21] who found a positive significant relationship between FGF-23 and (PO4)3- and Ca x PO4 product. This relationship was deliberate especially in patients with GFR less than 30 mL/min.
As regards PTH our study agreed with Carpenter, et al. [22], who found a significant positive correlation between PTH and FGF-23. This finding is similar to that described in chronic kidney disease, in which levels of both PTH and FGF-23 increase with declining renal function.
This was against Wesseling, et al. [23] and Kojima, et al. [24] who didn’t find a relation between plasma C-terminal FGF-23 levels and serum PTH in their cohorts. Also Uvner, et al. [8] didn’t find correlation between intact FGF -23 and PTH in ESRD patients.
Our study revealed that FGF-23 in all patients group had a negative correlation with HB. This agreed with Sliem, et al. [25]. who revealed that hemoglobin was negatively correlated with FGF-23 in patients with secondary hyperparathyroidism, which may have a partial role in the development of anemia in patients with CKD. High PTH levels may contribute to anemia by directly inhibiting the production of red blood cells and increasing their fragility also can cause marrow fibrosis and decreasing the production of red blood cells.
Upon doing regressive analysis for factors predicting FGF-23 level in our study; PTH level was the only independent factor correlated with FGF-23 level, absence of correlation with other factors like IDWG, may be due to small sample size in our study.
FGF-23 might be a marker of volume overload and LVH in ESRD patients, as it is positively correlated with (weight gain, SBP, DBP, MABP, IVS, PW and LVMI). Volume overload has a negative impact on morbidity and mortality in ESRD patients.
FGF-23 is a marker of bone diseases, as it positively correlated with PO4 and PTH. FGF-23 might be a marker of anemia as it has a negative correlation with HB.
Declarations
Ethics Approval and consent to participate: The study was approved by the research Ethics committee (REC) of internal medicine department at Ain Shams University and written consent was taken from the patients.
Consent for publication: All authors have approved the manuscript and agreed with its submission and publication to the journal.
Availability of data and material: All data and materials of our work are available (not online) and can be sent to the journal upon request.
- Asci G, Marcelli D, Celtik A, Grassmann A, Gunestepe K, et al. Comparison of Turkish and US haemodialysis patient mortality rates: An observational cohort study. Clin. Kidney J. 2016; 9: 476–480. PubMed: https://www.ncbi.nlm.nih.gov/pmc/articles/PMC4886919/
- Negishi K, Kobayashi M, Ochiai I, et al. Association between fibroblast growth factor 23 and left ventricular hypertrophy in maintenance hemodialysis patients - Comparison with B-type natriuretic peptide and cardiac troponin T. Circ J. 2010; 74: 2734–2740.
- Antlanger M, Hecking M, Haidinger M, Werzowa J, Kovarik JJ, et al. Fluid overload in hemodialysis patients: A cross-sectional study to determine its association with cardiac biomarkers and nutritional status. BMC Nephrol. 2013; 14. PubMed: https://pubmed.ncbi.nlm.nih.gov/24295522/
- Kalantar-Zadeh K, Regidor DL, Kovesdy CP, Wyck DV, Bunnapradist S, et al. Fluid retention is associated with cardiovascular mortality in patients undergoing long-term hemodialysis. Circulation. 2009;119 :671–679. PubMed: https://pubmed.ncbi.nlm.nih.gov/19171851/
- Lee MJ, Doh FM, Kim CH, Koo HM, Oh HJ, et al. Interdialytic weight gain and cardiovascular outcome in incident hemodialysis patients. Am J Nephrol. 2014; 39: 427–435. PubMed: https://pubmed.ncbi.nlm.nih.gov/24819227/
- Lullo LD, Gorini A, Russo D, Santoboni A, Ronco C. Left Ventricular Hypertrophy in Chronic Kidney Disease Patients: From Pathophysiology to Treatment. Cardio Renal Med. 2015; 5: 254–266. PubMed: https://pubmed.ncbi.nlm.nih.gov/26648942/
- Unver S, Kavlak E, Gümüsel HK, Celikbilek F, Esertas K, et al. Correlation between hypervolemia, left ventricular hypertrophy and fibroblast growth factor 23 in hemodialysis patients. Ren. Fail. 2015; 37: 951–956. PubMed: https://pubmed.ncbi.nlm.nih.gov/26030798/
- Ghonemy TA, Farag SE, Soliman SA, El-okely A, El-hendy Y, et al. Epidemiology and risk factors of chronic kidney disease in the El-Sharkia Governorate, Egypt. Saudi J Kidney Dis Transpl. 2016; 27: 111–117. PubMed: https://pubmed.ncbi.nlm.nih.gov/26787576/
- Kahraman A, Akdam H, Alp A, et al. Impact of interdialytic weight gain (IDWG) on nutritional parameters, cardiovascular risk factors and quality of life in hemodialysis patients. Bantao J. 2015; 13: 25–33.
- Rebholz CM, Grams ME, Coresh J, Selvin E, Inker LA, et al. Serum Fibroblast Growth Factor - 23 Is Associated with Incident Kidney Disease. J Am Soc Nephrol. 26: 192–200. PubMed: https://pubmed.ncbi.nlm.nih.gov/25060052
- Afifi A, Karim MA. Renal replacement therapy in Egypt: First annual report of the Egyptian Society of Nephrology, 1996. East. Mediterr Heal J. 1999; 5: 1023–1029.
- Mominadam S, Özkahya M, Kayikcioglu M, Toz H, Asci G, et al. Interdialytic blood pressure obtained by ambulatory blood pressure measurement and left ventricular structure in hypertensive hemodialysis patients. Hemodial. Int. 2008; 12: 322–327. PubMed: https://pubmed.ncbi.nlm.nih.gov/18638087/
- Cabrera C, Brunelli SM, Rosenbaum D, Anum E, Ramakrishnan K, et al. A retrospective, longitudinal study estimating the association between interdialytic weight gain and cardiovascular events and death in hemodialysis patients. BMC Nephrol. 2015; 16. PubMed: https://pubmed.ncbi.nlm.nih.gov/26197758
- Brown M, Burrows L, Pruett T, Burrows T. Hemodialysis-induced myocardial Stunning. Nephrol Nurs J. 2015; 42: 59-66. PubMed: https://pubmed.ncbi.nlm.nih.gov/26290919/
- Humalda JK, Riphagen IJ, Assa S, Hummel YM, Westerhuis R, et al. Fibroblast growth factor 23 correlates with volume status in haemodialysis patients and is not reduced by haemodialysis. Nephrol Dial Transplant. 2016; 31: 1494–1501. PubMed: https://pubmed.ncbi.nlm.nih.gov/26602863
- Minoo F, Alamdari A, Karimi H. Does fibroblast growth factor 23 correlates with volume status in hemodialysis patients? J Nephropathol. 2019; 8.
- Li JX, Yu GQ, Zhuang YZ. Impact of serum FGF23 levels on blood pressure of patients with chronic kidney disease. Eur Rev Med. Pharmacol Sci. 2018; 22: 721–725. PubMed: https://pubmed.ncbi.nlm.nih.gov/29461601/
- Unsal A, Budak SK, Koc Y, Basturk T, Sakaci T, et al. Relationship of fibroblast growth factor 23 with left ventricle mass index and coronary calcificaton in chronic renal disease. Kidney Blood Press Res. 2012; 36: 55–64. PubMed: https://pubmed.ncbi.nlm.nih.gov/22854270/
- Carpenter TO, Insogna KL, Zhang JH, et al. Circulating levels of soluble klotho and FGF23 in X-linked hypophosphatemia: Circadian variance, effects of treatment, and relationship to parathyroid status. J Clin Endocrinol Metab. 2010; 95.
- Wesseling-Perry K, Pereira RC, Wang H, Elashoff RM, Sahney S, et al. Relationship between plasma fibroblast growth factor-23 concentration and bone mineralization in children with renal failure on peritoneal dialysis. J Clin Endocrinol Metab. 2009; 94: 511–517. PubMed: https://pubmed.ncbi.nlm.nih.gov/19050056/
- Kojima F, Uchida K, Ogawa T, Tanaka Y, Nitta K. Plasma levels of fibroblast growth factor-23 and mineral metabolism in diabetic and non-diabetic patients on chronic hemodialysis. Int Urol Nephrol. 2008; 40: 1067–1074. PubMed: https://pubmed.ncbi.nlm.nih.gov/18791804/
- Sliem H, Tawfik G, Moustafa F, Zaki H. Relationship of associated secondary hyperparathyroidism to serum fibroblast growth factor-23 in end stage renal disease: A case-control study. Indian J Endocrinol Metab. 2011; 15: 105. PubMed: https://www.ncbi.nlm.nih.gov/pmc/articles/PMC3124995/